Findings of Environmental Inequality by Settlement Type: The Association Between Educational Level and Exposure to Ambient air Pollution Among Residents in Oslo and Akershus County
MSc
Department of Public Health Science, University of Life Sciences (NMBU), Norway
marenor7@gmail.comPhD, Senior scientist
Department of Air Quality and Noise, Division of Climate and Environmental Health, Norwegian Institute of Public Health, Norway
bentemargaret.oftedal@fhi.noPhD, Senior scientist
Department of Air Quality and Noise, Division of Climate and Environmental Health, Norwegian Institute of Public Health, Norway
norunhjertager.krog@fhi.noPhD, Associate Professor
Department of Public Health Science, Norwegian University of Life Sciences (NMBU), Norway
emma.charlott.andersson.nordbo@nmbu.noPublisert 22.05.2024, Kart og Plan 2024/1, Årgang 117, side 122-138
Ambient outdoor air pollution is a public health concern as it remains the largest environmental risk to health. European research shows that residents with lower socioeconomic status tend to be exposed to elevated air pollution concentrations. Yet, we know less about the distribution of air pollution according to socioeconomic factors in Norway. This study examined the association between educational level and exposure to air pollution, and whether this association differed between urban, suburban, subrural and rural settlements, among residents living in Oslo and Akershus county. We obtained data on exposure to fine particular matter and nitrogen dioxide at the residential addresses and educational level for 452 770 citizens in the registry-based national cohort NORCOHORT from the ELAPSE project. The association between educational level and exposure to air pollution differed by settlement type. Results revealed that citizens with low education residing in urban areas were at increased risk of being exposed to ambient air pollution compared to those with higher education, while the opposite pattern was found in suburban, subrural and rural areas.
Keywords
- air pollution ,
- socioeconomic position ,
- educational level ,
- urban areas ,
- settlement type
Introduction
Air pollution is considered one of the largest environmental risks to health both nationally and globally (Norwegian Environment Agency 2020; WHO 2021). This paper addresses exposure to the main contributors to local ambient air pollution in Norway, namely particulate matter with aerodynamic diameter less than 2.5 µm (PM2.5) and nitrogen dioxide (NO2) (Ministry of Climate and Environment 2021). PM is a generic term referring to all solid and liquid particles suspended in air that differ in size and composition. The fine particles (PM2.5) have attributes that make them particularly harmful, and they can remain suspended in air for weeks and be widely spread. Major sources of PM2.5 are road traffic, wood burning, industry and incinerators (Norwegian Institute of Public Health 2017; WHO 2021). NO2 is one of several highly reactive gases that is formed mainly during combustion processes of fuels, such as diesel, oil, and gas. Road traffic, and diesel exhaust emission in particular, are the main sources of NO2 pollution (Norwegian Institute of Public Health 2020).
According to the Norwegian Public Health Act (2011) and the Pollution Control Act (1981), the population should be protected from environmental health hazards. Thus, concentrations of PM2.5 and NO2 are continuously monitored and evaluated against given air quality criterion values and legally binding limit levels of annual air pollution. In Norway, the very recent updated air quality criterion values, which consider health effects of air pollution, are 5 μg/m3 and 10 μg/m3 for annual concentrations of PM2.5 and NO2, respectively (Norwegian Institute of Public Health 2023), whereas the legal limit levels are 10 μg/m3 for PM2.5 and 40 μg/m3 for NO2 (Ministry of Climate and Environment 2004). Data from long-term monitoring has revealed that Oslo, along with other cities and densely built-up areas in Norway, has challenges maintaining the concentrations of PM2.5 and NO2 at acceptable levels (Norwegian Institute of Public Health 2017; Norwegian Institute of Public Health 2020), which indicates that inhabitants are exposed to higher concentrations of ambient air pollution than what is recommended (Ministry of Climate and Environment 2004).
Mounting evidence has demonstrated that ambient air pollution adversely affects health (Chen & Hoek 2020; Huangfu & Atkinson 2020; Stafoggia et al. 2022). Exposure to PM2.5 and NO2 have been associated with increased risk of mortality (Atkinson et al. 2018; Chen & Hoek 2020; Raaschou-Nielsen et al. 2020), as well as increased risk of cardiovascular (Alexeeff et al. 2021; Stafoggia et al. 2014) and lung disease (Hu et al. 2022; Huangfu & Atkinson 2020), and cancer (Hvidtfeldt et al. 2022; Raaschou-Nielsen et al. 2013). Moreover, recent European research has revealed that long-term exposure to both PM2.5 and NO2, even at lower concentrations than those set by current limit values, are associated with all-cause mortality, mortality by cardiovascular and respiratory diseases, and by lung cancer (Stafoggia et al. 2022). Air pollution exposure has also been linked to higher levels of distress among Norwegian citizens (Amundsen et al. 2008), and the European Environment Agency (EEA) has estimated that about 1200 and 30 premature deaths in Norway in 2019 could be attributed to PM2.5 and NO2 exposure, respectively (European Environment Agency 2021).
Importantly, research has also identified social disparities in exposure to ambient air pollution worldwide (Fairburn et al. 2019; Raaschou-Nielsen et al. 2022; Temam et al. 2017; WHO 2021). Exposure to poor air quality has been linked to neighborhood deprivation, lower income (Barnes & Chatterton 2017; Fairburn et al. 2019; Milojevic et al. 2017; Morelli et al. 2016) and higher neighborhood unemployment rates (Temam et al. 2017). However, conflicting results are reported. Among others, Bertin et al. (2015) showed that neighborhood deprivation was associated with lower concentrations of NO2 in both urban and rural areas. Temam et al. (2017) have linked lower educational level to lower concentrations of NO2 exposure, while Ouidir et al. (2017) found higher concentrations of PM2.5 among highly educated in both urban and rural areas of France. These contradictory findings may be explained by the level of analysis (individual- vs. neighborhood-level) and that associations between socioeconomic factors and exposure to ambient air pollution are context-dependent (Temam et al. 2017). This stresses the importance of examining exposure to air pollution according to social factors at different scales and in various locations. To date, international studies using individual-level data have mainly focused on pregnant women or new mothers (Fairburn et al. 2019), and limited research has examined such relations within the Nordic context (Fairburn et al. 2019; Temam et al. 2017).
The few Nordic studies that exist on disparities in exposure to air pollution are from Denmark (Raaschou-Nielsen et al. 2022), Norway (Moss 2019; Næss et al. 2007) and Sweden (Olsson et al. 2020; Stroh et al. 2005). Raaschou-Nielsen et al. (2022) found that higher concentrations of air pollution were associated with higher socioeconomic position, but no clear pattern was observed for neighborhood-level indicators. In Norway, neighborhood deprivation has been linked to higher exposure to PM2.5 (Næss et al. 2007), while lower median household income has been associated with exposure to poorer air quality (Moss 2019). Similar results were found by Olsson et al. (2020), whereas Stroh et al. (2005) reported inconsistent results. It has been suggested that an urban–rural gradient in air pollution concentrations, where the concentrations tend to decrease with greater distance to the urban core, strongly influences the association between social factors and exposure to pollution (Fairburn et al. 2019; Stroh et al. 2005). Thus, further stratification of the data according to settlement types seems necessary to understand patterns of associations both within and across areas. Nevertheless, only one study conducted within the Nordic countries has tried to consider the influence of an urban–rural gradient in ambient air pollution on the relation between socioeconomic status and exposure to PM2.5 and NO2 (Raaschou-Nielsen et al., 2022).
Accordingly, we aimed to examine the association between educational level and exposure to air pollution, and whether this association differed between urban, suburban, subrural and rural areas, among residents in Oslo and Akershus county. Scrutinizing these relationships is important for several reasons. First, air pollution is a transboundary problem leading to large spatial differences in air quality (Im et al. 2019). This underscores the relevance of examining the geographical and social distribution of air pollution in the population in different contexts. Second, ambient air pollution is a recognized threat to human health that increases mortality and morbidity even at low exposure levels (Stafoggia et al. 2022), and there are concerns that poor air quality is unevenly distributed and affects the most vulnerable groups in society (Fairburn et al. 2019). This makes it vital to identify residents at risk of being most exposed to air pollution, particularly in areas with strong socioeconomic divides, such as Oslo (Ljunggren & Andersen 2015). Finally, as local planning can contribute to reducing inequalities (Vardoulakis et al. 2018), a more thorough understanding of the relations between socioeconomic factors and exposure to air pollution across the urban–rural axis is essential for developing targeted actions to ensure equitable cities that provide good-quality living environments for all residents.
Methods
Study Population and Data Sources
This cross-sectional study obtained data from NORCOHORT, which is a Norwegian register-based national cohort. The cohort was established as part of the international project Effects of Low-Level Air Pollution: A Study in Europe (ELAPSE), in which Norway is represented (Norwegian Institute of Public Health 2019). The population in NORCOHORT derived from the Census Register and included all Norwegian citizens > 30 years with a registered residential address in Norway per 1 January 2001. Data from about 2.7 million individuals are available through NORCOHORT.
For the purposes of this present study, we obtained data from a sample of 457 389 inhabitants > 40 years residing in Oslo and Akershus county per 1 January 2011. NORCOHORT contains data from a range of national registers (e.g., the National Population Register, Statistics Norway (SSB), Educational Registry, the Cause of Death Registry, Cancer Registry of Norway, and the Medical Birth Registry of Norway). Only data from the National Population Register, Educational Registry and SSB were obtained and utilized herein. Data from 2011 was selected to enable us to use the most recent air pollution data that could be linked to educational information obtained within the same year.
Study Area
The study area for this inquiry was Oslo, the capital of Norway, and the adjacent Akershus county. Oslo is located in southeastern Norway and is the largest city in the country. Oslo is surrounded by 21 municipalities that make up Akershus county (The Norwegian Mapping Authorities, 2023). Oslo and Akershus county together constitute the Oslo region (Figure 1). We chose to zoom in on Oslo and adjacent areas as Oslo is the Norwegian city with the greatest social and spatial divides (Andersen, Gerell & Hanssen 2021; Ljunggren, Toft & Flemmen 2017), which makes it a highly relevant study area for investigating socioeconomic and urban–rural differences in exposure to air pollution.
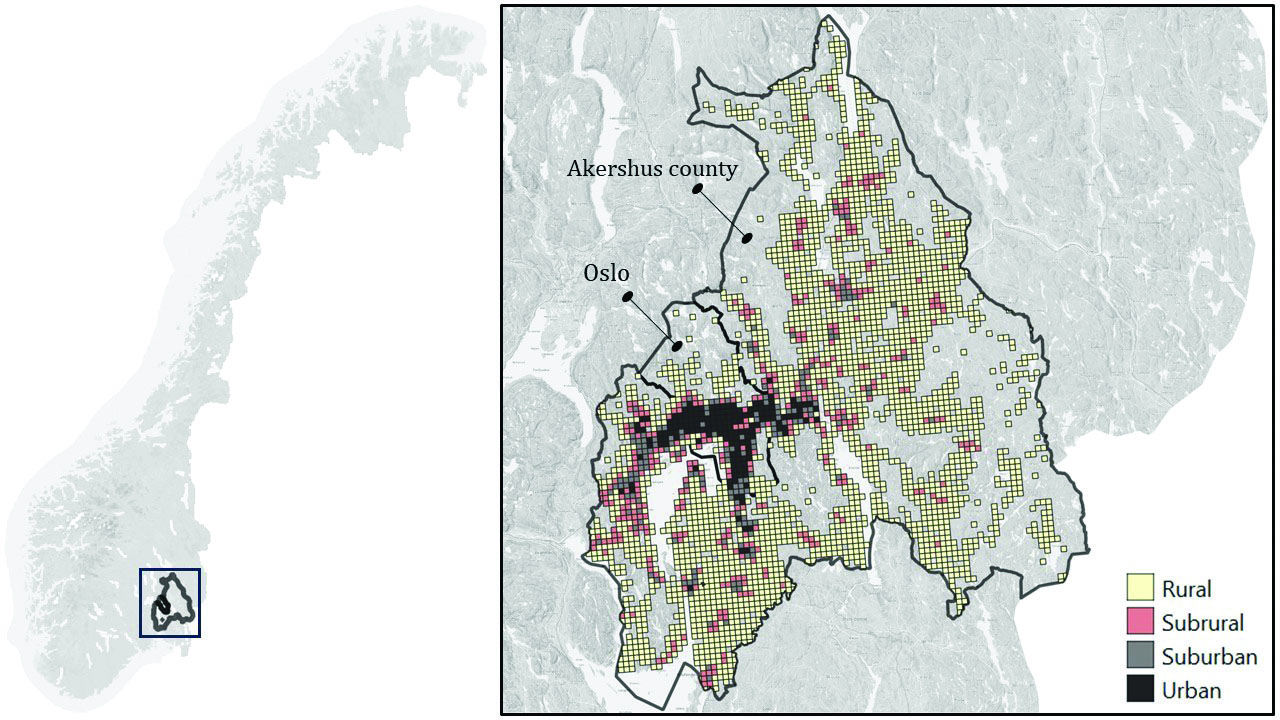
Figure 1.
Settlement Types Within Oslo and Akershus County Based on Statistical Grid Data (250m x 250m) from Statistics Norway.
Description of Key Variables
Information on each inhabitant’s highest completed level of education derived from a variable obtained through the Educational Registry and was used as a proxy for socioeconomic status. The rationale behind this choice was twofold. First, education is essential for people’s position in society, as it shapes occupational possibilities and earning potential (Khalatbari-Soltani et al. 2022; von dem Knesebeck, Verde & Dragano 2006). Second, education is commonly used as an indicator for socioeconomic status in public health and health inequalities research, and has been shown to be an important health determinant (Eikemo et al. 2008; Li et al. 2023). Education was defined as a three-level categorical variable (“lower secondary school or lower”, “high school” and “college/university degree”) based on existing research from the ELAPSE project (Rodopoulou et al. 2022; Stafoggia et al. 2022) and the ESCAPE project (Temam et al. 2017). Educational level was treated as an independent variable in the analyses.
The air pollution data obtained for this study derived from the ELAPSE project. The assessment model used to estimate exposures to PM2.5 and NO2 is described in detail elsewhere (de Hoogh et al. 2016; de Hoogh et al. 2018). In brief, daily concentrations of PM2.5 and NO2 were obtained from the EEA AirBase routine monitoring data from monitoring locations across Europe, including Norway, in 2010 (EEA 2018). Land-use regression (LUR) models, incorporating satellite-derived estimates of air pollutants, dispersion-model estimates, land-use and traffic data, were fitted to estimate annual average concentrations of both PM2.5 and NO2 (in µg/m3). The LUR model computations were performed at a 100x100 meter grid resolution across Norway including averages per 1 January 2011. Annual exposure values of PM2.5 and NO2 were assigned to each individual in NORCOHORT by linking the participants’ residential addresses to the grid data set. Individuals were given the grid value of PM2.5 and NO2 for the grid in which their residential address per 1 January 2011 were situated. We treated the annual averages of PM2.5 and NO2 as continuous dependent variables in the analyses.
To examine effect modification by settlement type on the association of educational level and exposure to ambient air pollution, we retrieved a variable classifying settlement type based on population size from Statistics Norway. The variable had seven categories, which were recoded into four settlement types. According to Statistics Norway (1999), a densely built-up area is defined as a settlement with >200 inhabitants where the distance between the houses does not exceed 50 meters. As such, the original category “dispersed built-up areas” was defined as rural areas. The categories “densely built-up areas with 200–499 inhabitants”, “…500–999 inhabitants” and “…1000–1999 inhabitants” were classified as subrural areas based on similar cut-offs as used by Bertin et al. (2015). The two categories “densely built-up areas with 2000–19999 inhabitants” and “…with 20000–99999 inhabitants” were recoded as suburban areas, while the final category “densely built-up areas with > 100000 inhabitants” was defined as urban areas.
To account for potential confounders, the following individual-level control variables were adjusted for in the analyses: age, gender, and family and immigrant background. These variables were selected a priori based on a directed acyclic graph depicting links and confounded paths between variables. Age was treated as a categorical variable with five categories (i.e., 40–49 years, 50–59 years, 60–69 years, 70–79 years and > 80 years), whereas family and immigrant background was treated as a categorical variable with six categories (i.e., born in Norway by two Norwegian-born parents, born in Norway by two foreign-born parents, born in Norway by one foreign-born parent, foreign-born with one Norwegian-born parent, foreign-born with two Norwegian-born parents, immigrant).
Statistical Analyses
Statistical analyses were performed using SPSS Statistics version 28.0. Characteristics of the sample and exposure to ambient air pollution by level of education and settlement type were analyzed using descriptive statistics. Results from these analyses are presented as frequencies and proportions, as well as annual averages (in µg/m3) with ranges. Associations between educational level and exposure to air pollution were examined using linear regression; 4619 participants (1% of the total sample) were excluded from the regression models due to missing data. As such, the regression analyses were limited to participants with complete educational, air pollution and model-covariate data (N = 452 770) and proceeded in three consecutive steps. First, we estimated crude and adjusted associations between educational level and exposure to PM2.5 and NO2 using linear regression. Second, an interaction term between educational level and settlement type was added, and two regression models, one for each dependent variable (i.e., PM2.5 and NO2) were fitted to examine whether settlement type moderated the associations between educational level and exposure to PM2.5 and NO2. Based on whether the effect modification was statistically significant at the significance level of 5%, we assessed if the associations differed for rural, subrural, suburban and urban settlements by running stratified analyses by settlement type. We adjusted the associations for the effect of age, gender and family and immigrant background by running multiple regression analyses where these variables were included in the models. Unstandardized regression coefficients (B) with 95% confidence intervals (CI) are reported.
Ethical Considerations
The study has been conducted in accordance with relevant ethical guidelines and regulations, and data management and statistical analyses were conducted through the platform Services for Sensitive Data (TSD). A notification of change was submitted to the Regional Committee for Medical Research Ethics (REK), which reviewed and approved the use of NORCOHORT data for the purposes of this study.
Results
Study-Sample Characteristics and Ambient Air Pollution Concentrations
The total sample comprised of 457 389 inhabitants aged > 40 years residing in Oslo and Akershus county. Most of the inhabitants were born in Norway by two Norwegian-born parents (88.4%) and resided in urban areas (75.8%). Just over a fifth had lower secondary school or lower as their highest level of education, while 41.1% and 37.0% had completed high school and a college/university degree, respectively (Table 1).
Table 1.
Characteristics | N (%) |
|---|---|
Gender | |
Men | 220 137 (48.1) |
Women | 237 252 (51.9) |
Missing | 0 (0.0) |
Age | |
40–49 years | 128 673 (28.1) |
50–59 years | 121 909 (26.7) |
60–69 years | 104 301 (22.8) |
70–79 years | 55 720 (12.2) |
80 years and older | 46 786 (10.2) |
Missing | 0 (0.0) |
Family and immigrant background | |
Born in Norway by two Norwegian-born parents | 404 482 (88.4) |
Born in Norway by two foreign-born parents | 1 046 (0.2) |
Born in Norway with one foreign-born parent | 14 392 (3.1) |
Foreign-born with one Norwegian-born parent | 2 976 (0.7) |
Foreign-born with two Norwegian-born parents | 3 575 (0.8) |
Immigrant | 30 918 (6.8) |
Missing | 0 (0.0) |
Highest level of education | |
Lower secondary school or lower | 96 964 (21.2) |
High school | 187 882 (41.1) |
College/university degree | 169 427 (37.0) |
Missing | 3 116 (0.7) |
Settlement type | |
Rural areas | 28 016 (6.1) |
Subrural areas | 16 045 (3.5) |
Suburban areas | 64 895 (14.2) |
Urban areas | 346 823 (75.8) |
Missing | 1 610 (0.4) |
Table 2 shows the annual averages and ranges of the air pollutants for residents with different educational level residing in rural, subrural, suburban and urban areas. The analyses revealed a gradient in exposure to air pollution by settlement type with inhabitants residing in urban areas being exposed to the highest concentrations of both PM2.5 and NO2. Both the Norwegian legally binding limit of annual PM2.5 (10 µg/m3) and the recent updated air quality criterion limit (5 µg/m3) were exceeded in all areas. We found that the annual average of residential NO2 was twice as high in urban compared to rural areas. The Norwegian legally binding limit (40 µg/m3) was exceeded in urban areas only, while the new air quality criterion value (10 µg/m3) was exceeded in all areas. We found that in rural, subrural and suburban areas inhabitants with a college/university degree were exposed to the highest concentrations of ambient air pollution. In urban areas, inhabitants with lower secondary school or lower were found to be exposed to the highest concentrations of both PM2.5 and NO2.
Table 2.
Annual average (Range) of PM2.5 | ||||
|---|---|---|---|---|
Educational level | Rural (N = 27 897) | Subrural (N = 15 992) | Suburban (N = 64 657) | Urban (N = 344 224) |
Lower secondary school or lower | 9.2 (2.1–14.5) | 10.7 (4.2–14.6) | 11.5 (4.3–15.0) | 13.9 (6.8–18.8) |
High school | 9.5 (2.1–14.5) | 10.8 (4.2–14.6) | 11.8 (4.3–15.9) | 13.7 (6.6–19.0) |
College/university degree | 9.8 (2.4–14.4) | 10.8 (4.2–14.6) | 12.2 (5.0–15.0) | 13.7 (6.6–19.0) |
Annual average (Range) of NO2 | ||||
Lower secondary school or lower | 9.5 (2.0–26.0) | 12.9 (4.5–27.2) | 15.9 (4.9–29.7) | 26.0 (10.3–61.0) |
High school | 10.2 (2.0–26.9) | 13.1 (4.4–27.2) | 16.5 (4.8–35.4) | 25.4 (10.1–61.0) |
College/university degree | 10.9 (2.1–27.7) | 13.2 (5.0–26.3) | 17.2 (4.9–28.1) | 25.7 (10.2–61.0) |
Association Between Educational Level and Exposure to Air Pollution
Results from linear regression models showed significant associations between educational level and exposure to PM2.5 and NO2 in the total sample, with higher education being related to lower air pollution concentrations in the crude model. After adjustment, results showed that inhabitants with lower secondary school or lower were exposed to 0.51 µg/m3 (95% CI = –0.52, –0.49) and 2.10 µg/m3 (95% CI = –2.15, –2.04) lower annual concentrations of PM2.5 and NO2, respectively, compared to residents with a college/university degree (data not shown). Table 3 presents results from adjusted linear regression models for the association between education and exposure to PM2.5 and NO2 stratified by settlement type. As for the unstratified analyses, stratified models revealed that residents living in rural, subrural and suburban areas with both lower secondary school or less and high school were exposed to lower annual averages of both PM2.5 and NO2 compared to inhabitants with a college/university degree living in the same areas. In urban areas, the trend of the associations changed. Residents in urban areas with lower secondary school or lower were exposed to significantly higher annual concentrations of PM2.5 (B = 0.17; 95% CI = 0.16, 0.19) and NO2 (B = 0.29; 95% CI = 0.24, 0.34) compared to residents with a college/university degree (Table 3). The shape of the association between educational level and exposure to air pollution differed for PM2.5 and NO2 in urban areas (Figure 2A and 2B). We observed a gradient in annual exposure levels with increasing annual average of PM2.5 with decreasing educational level. For NO2, we identified a U-shaped association with highest and lowest educational level being associated with higher exposure to NO2.
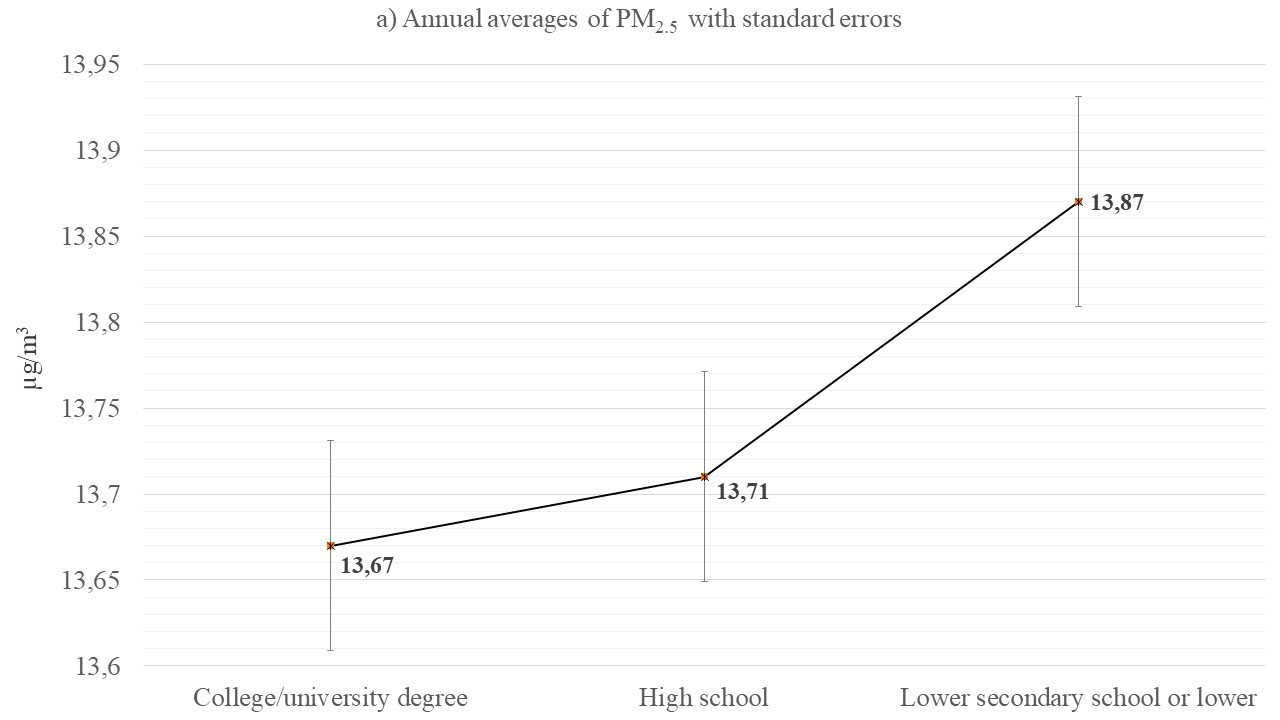
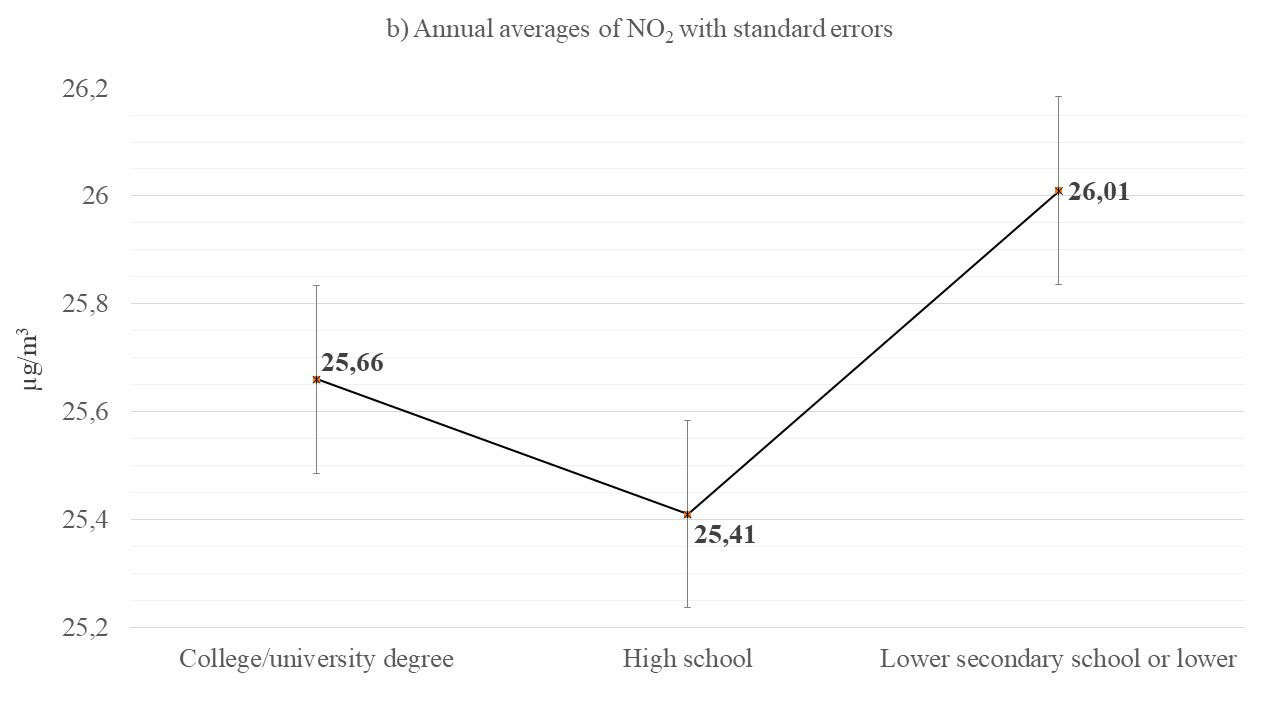
Figure 2.
Shape of the Associations Between Educational Level and Exposure to PM2.5 (a) and NO2 (b) Among Inhabitants Residing in Urban Areas.
Table 3.
Unstandardized B (95% CI)a for exposure to PM2.5 | ||||
|---|---|---|---|---|
Level of education | Rural (N = 27 897) | Subrural (N = 15 992) | Suburban (N = 64 657) | Urban (N = 344 224) |
College/university degree | Reference | Reference | Reference | Reference |
High school | –0.26 (–0.32, –0.20) | –0.09 (–0.16, –0.03) | –0.40 (–0.43, –0.38) | 0.03 (0.02, 0.04) |
Lower secondary school or lower | –0.65 (–0.72, –0.59) | –0.21 (–0.28, –0.14) | –0.70 (–0.74, –0.67) | 0.17 (0.16, 0.19) |
Unstandardized B (95% CI)a for exposure to NO2 | ||||
Level of education | Rural (N = 27 897) | Subrural (N = 15 992) | Suburban (N = 64 657) | Urban (N = 344 224) |
College/university degree | Reference | Reference | Reference | Reference |
High school | –0.69 (–0.79, –0.58) | –0.19 (–0.33, –0.06) | –0.80 (–0.87, –0.73) | –0.27 (–0.31, –0.24) |
Lower secondary school or lower | –1.45 (–1.57, –1.33) | –0.48 (–0.62, –0.33) | –1.40 (–1.48, –1.32) | 0.29 (0.24, 0.34) |
Abbreviations: CI; confidence interval.
aAdjusted for age, gender and family and immigrant background.
Discussion
We found that inhabitants living in urban areas were exposed to the highest concentrations of both PM2.5 and NO2. The Norwegian legally binding limit value of annual average PM2.5 (10 µg/m3) was exceeded across all settlement types in Oslo and Akershus county. Low educational level was associated with lower exposure to both PM2.5 and NO2 in rural, subrural and suburban areas. However, in urban areas we found that residents with lower secondary school or lower were exposed to significantly higher annual concentrations of PM2.5 and NO2 than residents with a college/university degree.
The identified pattern of higher concentrations of PM2.5 and NO2 in urban areas aligns with previous international and national research indicating higher levels for most air pollutants in urban areas (Fairburn et al. 2019; Moss 2019). Road traffic has increased steadily in the largest Norwegian cities, including Oslo (Jean-Hansen et al. 2009), and since traffic is the dominant source of air pollution (Norwegian Institute of Public Health 2017; Norwegian Institute of Public Health 2020), this was not unexpected. However, the concentrations of both PM2.5 and NO2 have decreased during the last decade (Norwegian Institute of Public Health 2022). This decline is related to the contribution of wood burning to PM2.5 concentrations and the increasing number of electric cars, which has reduced NO2 emissions. Nevertheless, considering that the majority of the inhabitants in our study actually resided in urban areas (75.8%), this implies that a large share of the population is exposed to potentially harmful concentrations of air pollution on a daily basis that could have serious health consequences. Though the highest air pollution concentrations were found in urban areas, the air quality criterium of PM2.5 (5 µg/m3), where considerations of health effects are the main focus, was exceeded across all settlement types. A similar exceedance was also found for NO2. This underscores that air pollution cannot be deemed as an urban problem only, and exposure reduction measures is important across locations.
Fairburn et al. (2019) concluded that lower socioeconomic status was associated with exposure to poorer air quality across the European region. Nevertheless, the results are very inconsistent across studies, and previous research using education as an indicator of socioeconomic status have reported mixed results (Fairburn et al. 2019). Due to large spatial differences in air quality (Im et al. 2019) along with great variations in inequality across countries and cities (Eurostat, 2023), inconsistent associations across contexts must be expected. These inconsistencies in results demonstrate the importance of examining the distribution of air pollution according to social factors across contexts, and importantly, we examined whether the association between educational level and exposure to air pollution differed by settlement type. Thus, our study adds some valuable and nuanced findings to the inconsistent evidence by unveiling different urban–rural patterns of associations across Oslo and Akershus county. Explicitly, the stratified models detected relationships contradicting the principle of environmental equity, according to which no group of people in society should bear a disproportionate share of harmful exposure to environmental hazards (Dempsey et al. 2012). The stratified results for settlement types outside the urban core showed that lower educational level was related to lower air pollution concentrations of PM2.5 and NO2 in the adjusted models. Similar findings have been reported in other European cities (Bertin et al., 2015; Forastiere et al. 2007; Ouidir et al. 2017) and Nordic countries (Raaschou-Nielsen et al. 2022; Stroh et al. 2005), although Forastiere et al. (2007) and Stroh et al. (2005) did not account for urban–rural differences.
In urban areas, we found an increasing gradient in exposure to PM2.5 with lower educational level, while the association of exposure to NO2 and educational level was U-shaped. When accounting for settlement types in a large region in France, Ouidir et al. (2017) did not find such results for PM2.5 and NO2 exposure in urban areas. They reported higher concentrations of PM2.5 among the highly educated across all settlement types, while lower educational level was related to higher air pollution concentrations of NO2 in urban areas. Additionally, neither Bertin et al (2015) nor Raaschou-Nielsen et al. (2022) identified similar urban–rural differences as we did in this current study. Nevertheless, comparable U-shaped patterns for NO2 exposure have been observed in other studies where data for smaller urban areas have been used (Fairburn et al. 2019). An explanation of our results could be that residents with lower education may reside in less attractive and more densely trafficked urban areas. Despite a lack of data on whether air pollution influences housing prices, it is known that road traffic noise has an impact on housing prices in Norway, and housing is less expensive in areas with more road traffic noise and vice versa (Norwegian Public Roads Administration 2005). This is likely to impact where people of different socioeconomic background can afford to live. In addition, it is conceivable that people with higher education are more conscious of road traffic as a major source of air pollution in urban areas, resulting in self-selection of highly educated people into neighborhoods with less road traffic based on preferences (Næss 2009). Unfortunately, we lacked data on contextual variables like housing prices, road network and transport infrastructure, and were not able to consider such factors in the statistical models. However, local land-use predictors of air pollution (e.g., road length and land cover) were included in the LUR models assessing exposure to air pollution. Considering that traffic is the main source of air pollution (Norwegian Institute of Public Health 2017; Norwegian Institute of Public Health 2020), it is reasonable to assume that areas with poor air quality have greater transport- and traffic-related load. This shows that characteristics of the urban environment matter to people, and all residents in urban areas of Oslo and Akershus county, and in particular inhabitants with low educational level, would benefit from a reduction of both PM2.5 and NO2 concentrations based on the reported findings.
As stated, the stratified analyses of inhabitants living in rural, subrural and suburban areas revealed that lower educational level was related to lower air pollution concentrations, which corresponded with results from the unstratified models. There are several possible explanations for these results. First, those with higher education living in these areas likely do not have their workplace where they reside. Figures from Statistics Norway show that nearly 38.0% of all people with their workplace in Oslo commuted from surrounding municipalities in 2021 (Statistics Norway 2020). Thus, for commuting purposes, people with higher education might choose to live more centrally and closer to traffic nodes in rural, subrural and suburban areas, exposing them to higher concentrations of air pollution than people with lower levels of education residing in the same settlement types. Second, outside the urban area a proportion of inhabitants with lower education may be occupied in agriculture. Hence, they may live further away from the center within their settlement type to a greater extent than people with higher education. Third, and related to the first point, housing is less expensive further away from traffic nodes (Statistics Norway 2023), which may contribute to the reverse social inequal distribution of exposure to ambient air pollution in rural, subrural and suburban areas where inhabitants with lower education are exposed to the lowest air pollution concentrations. As such, our findings demonstrate that associations between educational level and exposure to air pollution are likely driven by different mechanisms across settlement types. This underscores the importance of considering areas with comparable mechanisms for settlement pattern when examining relations between socioeconomic status and environmental factors. It should also be stated that research has reported that even though disadvantaged groups in society are not always exposed to the highest air pollution concentrations, they may be more susceptible to air pollution-related hazards compared to people of higher socioeconomic status (Deguen & Zmirou-Navier 2010). This illustrates that the issue of inequality in air pollution exposure and health is complex and must be considered in public health and planning policies to prevent additional burdens among the most susceptible groups in the population.
In 2018, the Norwegian Government appointed a committee to examine living conditions in Norwegian cities. The report from the commission, which was published in 2020, points at the structural causes of social and spatial inequalities and states that a comprehensive approach is essential to tackle the spatial accumulation of disadvantage (Andersen, Gerell & Hanssen 2021; NOU 2020:16). Lately, similar recommendations have been specified to address inequalities in health and wellbeing in Norway (Goldblatt et al. 2023). These recommendations are equally applicable to address inequality in air pollution exposure, and urban development and housing policies (Andersen, Gerell & Hanssen 2021), as well as investments in public transport, urban design interventions, and green space provision could represent important points of departure (Glazener & Khreis 2020; Vardoulakis et al. 2018). In Norway, the Planning and Building Act (2008) provides the legislative framework for planning and building activities. According to this act, planning should ensure good environments and living conditions for all and counteract social inequalities. Further, the planning must be coordinated with other sectoral laws, such as the Public Health Act (2011), which requires that municipalities address social inequalities and promote public health through local development and planning. Hence, the planning authorities have juridical instruments to ensure that urban development distributes benefits, such as green spaces, tunnels and public transport links, and burdens, such as land-intensive and polluting road infrastructure and industrial activities, equally in society (NOU 2020:16).
Study Strengths and Weaknesses
Key strengths of this study include the large and representative sample of Norwegian residents living in Oslo and Akershus county and the reliable and almost complete registry data for sociodemographic variables included in the analyses, which limited the risk of selection bias. Although 4619 participants (1% of the total sample) were excluded from the regression models due to missing data, it is less likely that this introduced bias to the results. The linkage of high spatial resolution exposure values of PM2.5 and NO2 based on fine-scale land-use and traffic data for geocoded residential addresses is another strength. However, computing individual-level exposure to air pollutants is challenging (Franck et al. 2014; Norwegian Institute of Public Health 2017; Norwegian Institute of Public Health 2020). As such, there is uncertainty in the air pollution concentrations that introduces measurement errors for different reasons.
First, calculations of PM2.5 and NO2 were based on traffic-exhaust emissions. Considering that wood burning also represent an important source of PM2.5, these values are more prone to errors than the NO2 values, as NO2 pollution mainly stems from road traffic. Second, only ambient outdoor air pollution was assessed, and inhabitants’ actual exposure levels might be different when accounting for indoor air pollution. Additionally, people are mobile, and the place of residence is usually not the same as the workplace. Residents spend large parts of the day at work in areas that likely have distinct air pollution concentrations that modify personal exposure, and this was not considered in this study. In any case, remote working has become more common in recent years, highlighting the importance of the residential environment during working hours as well. Last, there could potentially be some inaccuracy in the map coordinates for the residential addresses that could have led to erroneous assignment of exposure values based on incorrect grids.
As the educational variable was register-based, our results are not prone to non-response bias. However, it should be mentioned that the original variable was grouped into three categories. Although this divide was based on commonly applied categories (Stafoggia et al. 2022; Temam et al. 2017), nuances may have been lost and decreased the variance between education groups. It could be considered a weakness that only educational level was used as an indicator of socioeconomic status. However, knowing that educational level is found to be a determinant of later measures of socioeconomic status, such as income and occupation (Khalatbari-Soltani et al. 2022; von dem Knesebeck, Verde & Dragano 2006), we argue that educational attainment could be regarded as a suitable measure of people’s position in society. Additionally, education is commonly used as a proxy for socioeconomic status in public health and health inequalities research (Eikemo et al. 2008), and democratic reforms have ensured broad access to the school system, including higher education, in Norway (Reisel, Hermansen & Kindt 2019), which favors the use of education as an indicator in the current study.
Another limitation is that we only investigated the population aged > 40 years, which was determined by the origin of the data. Accordingly, the results specifically apply to the Norwegian population aged 40 years and older living in Oslo and Akershus county. However, this can equally be considered a strength of our study as the inhabitants included have reached a stage in life where most have completed their education. A more stable educational profile of our sample likely contributed to provide a more valid representation of the true association between level of education and exposure to air pollution. Alongside this, it should be mentioned that financial wealth is shown to increase with age in Norway, with younger people being placed at the bottom of the wealth distribution (Epland & Kirkeberg 2012). As such, inhabitants aged above 40 years might be able to afford to live in different areas than people in their early twenties and thirties, regardless of educational level, which reinforces the strengths of considering the population aged > 40 years and adjusting for age in the statistical analyses.
This study is also limited by the constraints of the cross-sectional design, which prevents us from making inferences about causality. Yet, reverse causality (i.e., that exposure to air pollution determines level of education) is less plausible, thus strengthening our interpretations. Use of a directed acyclic graph for an a priori selection of which variables to adjust for in the regression models could be considered a strength. Nevertheless, although we adjusted for important confounders in the analyses, variables other than age, gender and family background could influence the results, making our study prone to residual cofounding. Finally, based on the conflicting evidence across studies and context, it is reasonable to assume that associations between educational level and exposure to air pollution are highly location-specific and that our results cannot be directly generalized to other parts of Norway or European cities and countries.
Conclusion
This Norwegian population-based study revealed a gradient in exposure to air pollution by settlement type. Inhabitants living in urban areas were exposed to the highest concentrations of both PM2.5 and NO2. Low educational level was associated with lower exposure to both PM2.5 and NO2 in rural, subrural and suburban areas, whereas urban residents with lower secondary school or lower were exposed to significantly higher annual concentrations of both PM2.5 and NO2 compared to residents with a college/university degree. Health-based air quality criterion values for both PM2.5 and NO2 were exceeded in all settlement types, but in particular inhabitants with low educational level living in urban areas, would benefit from a reduction of both PM2.5 and NO2 concentrations. This must be considered in public health and planning policies that aim to ensure environmental equity.
References
-
Alexeeff, S. E.,Liao, N. S.,Liu, X.,Van DenEeden, S. K.&Sidney, S.(2021). Long-term PM2. 5 exposure and risks of ischemic heart disease and stroke events: review and meta-analysis.
Journal of the American Heart Association
, 10 (1): e016890. https://doi.org/10.1161/jaha.120.016890 -
Amundsen, A. H.,Klæboe, R.&Fyhri, A.(2008). Annoyance from vehicular air pollution: Exposure–response relationships for Norway.
Atmospheric Environment
, 42 (33): 7679–7688. https://doi.org/10.1016/j.atmosenv.2008.05.026 -
Andersen, B.,Gerell, M.&Hanssen, G. S.(2021). NOU 2020:16: Levekår i byer. Gode lokalsamfunn for alle.
Nordic Journal of Urban Studies
1 (1): 78–90. https://doi.org/10.18261/issn.2703-8866-2021-01-06 -
Atkinson, R. W.,Butland, B. K.,Anderson, H. R.&Maynard, R. L.(2018). Long-term concentrations of nitrogen dioxide and mortality.
Epidemiology
, 29 (4): 460–472. https://doi.org/10.1097/ede.0000000000000847 -
Barnes, J.&Chatterton, T.(2017). An environmental justice analysis of exposure to traffic-related pollutants in England and Wales.
WIT Transactions on Ecology and the Environment
, 210 (12): 431–442. https://doi.org/10.2495/sdp160361 -
Bertin, M.,Chevrier, C.,Serrano, T.,Monfort, C.,Rouget, F.,Cordier, S.&Viel, J.-F,(2015). Association between prenatal exposure to traffic-related air pollution and preterm birth in the PELAGIE mother–child cohort, Brittany, France. Does the urban–rural context matter?
Environmental Research
, 142: 17–24. https://doi.org/10.1016/j.envres.2015.06.005 -
Chen, J.&Hoek, G.(2020). Long-term exposure to PM and all-cause and cause-specific mortality: A systematic review and meta-analysis.
Environment International
, 143: 105974. https://doi.org/10.1016/j.envint.2020.105974 -
de Hoogh, K.,Gulliver, J.,van Donkelaar, A.,Martin, R. V.,Marshall, J. D.,Bechle, M. J.,Cesaroni, G.,Pradas, M. C.,Dedele, A.&Eeftens, M.(2016). Development of West-European PM2.5 and NO2 land use regression models incorporating satellite-derived and chemical transport modelling data.
Environmental research
, 151: 1–10. https://doi.org/10.1016/j.envres.2016.07.005 -
de Hoogh, K.,Chen, J.,Gulliver, J.,Hoffmann, B.,Hertel, O.,Ketzel, M.,Bauwelinck, M.,van Donkelaar, A.,Hvidtfeldt, U. A.&Katsouyanni, K., et al. (2018). Spatial PM2.5, NO2, O3 and BC models for Western Europe – Evaluation of spatiotemporal stability.
Environment International
, 120: 81–92. https://doi.org/10.1016/j.envint.2018.07.036 -
Deguen, S.&Zmirou-Navier, D.(2010). Social inequalities resulting from health risks related to ambient air quality—A European review.
European Journal of Public Health
, 20 (1): 27–35. https://doi.org/10.1093/eurpub/ckp220 -
Dempsey, N.,Brown, C.&Bramley, G.(2012). The key to sustainable urban development in UK cities? The influence of density on social sustainability.
Progress in planning
, 77 (3): 89–141. https://doi.org/10.1016/j.progress.2012.01.001 -
EEA. (2018).
AirBase – The European Air Quality Database
.Version 8
. [Online]. Available: https://www.eea.europa.eu/data-and-maps/data/airbase-the-european-air-quality-database-8 -
Eikemo, T. A.,Huisman, M.,Bambra, C.&Kunst, A. E.(2008). Health inequalities according to educational level in different welfare regimes: a comparison of 23 European countries.
Sociology of health & illness
, 30 (4): 565–582. https://doi.org/10.1111/j.1467-9566.2007.01073.x -
Epland, J.&Kirkeberg, M. I.(2012). Wealth distribution in Norway.
Evidence from a new register-based data source
.Oslo
:Statistics Norway
. -
Eurostat. (2023).
Gini coefficient of equivalised disposable income – EU-SILC survey
. [Online]. Available: https://ec.europa.eu/eurostat/databrowser/view/tessi190/default/table -
European Environment Agency. (2021).
Air quality in Europe 2021
. [Online] Available: https://www.eea.europa.eu/publications/air-quality-in-europe-2021 -
Fairburn, J.,Schüle, S. A.,Dreger, S.,KarlaHilz, L.&Bolte, G.(2019). Social Inequalities in Exposure to Ambient Air Pollution: A Systematic Review in the WHO European Region.
International Journal of Environmental Research and Public Health
, 16 (17): 3127. https://doi.org/10.3390/ijerph16173127 -
Forastiere, F.,Stafoggia, M.,Tasco, C.,Picciotto, S.,Agabiti, N.,Cesaroni, G.&Perucci, C. A.(2007). Socioeconomic status, particulate air pollution, and daily mortality: Differential exposure or differential susceptibility.
American Journal of Industrial Medicine
, 50 (3): 208–216. https://doi.org/10.1002/ajim.20368 -
Franck, U.,Klimeczek, H. J., &Kindler, A.(2014). Social indicators are predictors of airborne outdoor exposures in Berlin.
Ecological indicators
, 36: 582–593. https://doi.org/10.1016/j.ecolind.2013.08.023 -
Goldblatt, P.,Castedo, A.,Allen, J.,Lionello, L.,Bell, R.,Marmot, M.,von Heimburg, D.&Ness, O.(2023). Rapid review of inequalities in health and wellbeing in Norway since 2014.
Norway: Institute of Health Equity
. -
Glazener, A.&Khreis, H.(2020). Best practices for air quality and active transportation. InKhreis, H.,Nieuwenhuijsen, M.,Zietsman, J.&Ramani, T.(
eds
)Traffic-Related Air Pollution
, pp. 405–435:Elsevier
. https://doi.org/10.1016/b978-0-12-818122-5.00016-8 -
Hu, Y.,Wu, M.,Li, Y.&Liu, X.(2022). Influence of PM1 exposure on total and cause-specific respiratory diseases: a systematic review and meta-analysis.
Environmental Science and Pollution Research
, 29 (10): 15117–15126. https://doi.org/10.1007/s11356-021-16536-0 -
Huangfu, P.&Atkinson, R.(2020). Long-term exposure to NO2 and O3 and all-cause and respiratory mortality: A systematic review and meta-analysis.
Environment International
, 144: 105998. https://doi.org/10.1016/j.envint.2020.105998 -
Hvidtfeldt, U. A.,Taj, T.,Chen, J.,Rodopoulou, S.,Strak, M.,de Hoogh, K.,Andersen, Z. J.,Bellander, T.,Brandt, J.,Fecht, D., et al. (2022). Long term exposure to air pollution and kidney parenchyma cancer – Effects of low-level air pollution: a Study in Europe (ELAPSE).
Environmental Research
, 215: 114385. https://doi.org/10.1289/isee.2022.o-op-106 -
Im, U.,Christensen, J. H.,Nielsen, O. K.,Sand, M.,Makkonen, R.,Geels, C.,Anderson, C.,Kukkonen, J.,Lopez-Aparicio, S.&Brandt, J.(2019). Contributions of Nordic anthropogenic emissions on air pollution and premature mortality over the Nordic region and the Arctic.
Atmospheric Chemistry and Physics
, 19 (20): 12975–12992. https://doi.org/10.5194/acp-19-12975-2019 -
Jean-Hansen, V.,Hanssen, J. U.&Aas, H.(2009).
Storbytrafikken i dag og fem til ti år framover
.Oslo
:Institute of Transport Economics
. [Online]. Available: https://www.toi.no/getfile.php/1312291-1251187659/Publikasjoner/T%C3%98I%20rapporter/2009/1026-2009/1026-2009-el.pdf -
Khalatbari-Soltani, S.,Maccora, J.,Blyth, F. M.,Joannès, C.&Kelly-Irving, M.(2022). Measuring education in the context of health inequalities.
International Journal of Epidemiology
, 51 (3): 701–708. https://doi.org/10.1093/ije/dyac058 -
Li, B.,Allebeck, P.,Burstöm, B.,Danielsson, A. K.,Degenhardt, L.,Eikemo, T. A.,Ferrari, A.,Knudsen, A. K.,Lundin, A.&Manhica, H.(2023). Educational level and the risk of mental disorders, substance use disorders and self-harm in different age-groups: A cohort study covering 1, 6 million subjects in the Stockholm region.
International Journal of Methods in Psychiatric Research
: e1964. https://doi.org/10.1002/mpr.1964 -
Ljunggren, J.&Andersen, P. L.(2015). Vertical and horizontal segregation: Spatial class divisions in Oslo, 1970–2003.
International Journal of Urban and Regional Research
, 39 (2): 305–322. https://doi.org/10.1111/1468-2427.12167 -
Ljunggren, J.,Toft, M.&Flemmen, M.(2017). Geografiske klasseskiller. Fordelingen av goder og byrder mellom Oslos bydeler. IJ. Ljunggren(
Red.
),Oslo – ulikhetenes by
: s. 359–376).Oslo
:Cappelen Damm akademisk
. -
Milojevic, A.,Niedzwiedz, C. L.,Pearce, J.,Milner, J.,MacKenzie, I. A.,Doherty, R. M.&Wilkinson, P.(2017). Socioeconomic and urban–rural differentials in exposure to air pollution and mortality burden in England.
Environmental Health
, 16 (1): 104. https://doi.org/10.1186/s12940-017-0314-5 -
Ministry of Climate and Environment. (2004).
Forskrift om begrensning av forurensning
. [Online]. Available: https://lovdata.no/dokument/SF/forskrift/2004-06-01-931 -
Ministry of Climate and Environment. (2021).
Den lokale luftkvaliteten i Norge
. [Online]. Available: https://www.regjeringen.no/no/tema/klima-og-miljo/forurensning/innsiktsartikler-forurensning/lokal-luftkvalitet/id2344384/ -
Morelli, X.,Rieux, C.,Cyrys, J.,Forsberg, B.&Slama, R.(2016). Air pollution, health and social deprivation: A fine-scale risk assessment.
Environmental Research
, 147: 59–70. https://doi.org/10.1016/j.envres.2016.01.030 -
Moss, A. H.(2019).
Norwegian inequality in two dimensions: air pollution and income
. Master thesis,School of Economics and Business, Norwegian University of Life Sciences, Ås
. [Online]. Available: https://nmbu.brage.unit.no/nmbu-xmlui/handle/11250/2600168 -
Norwegian Environment Agency. (2020).
Grenseverdier for svevestøv – Forslag til reviderte grenseverdier for PM10 og PM2,5. Rapport M-1669
.Oslo
:Miljødirektoratet
. -
Norwegian Institute of Public Health. (2019).
Forskningsprosjektet ELAPSE: Betydningen av lave nivåer av luftforurensning for forekomst av sykdom og for tidlige dødsfall – prosjektbeskrivelse
. [Online]. Available: https://www.fhi.no/prosjekter/forskningsprosjektet-elapse/ -
Norwegian Institute of Public Health. (2017).
Svevestøv
. [Online]. Available: https://www.fhi.no/nettpub/luftkvalitet/temakapitler/svevestov/?term=&h=1 -
Norwegian Institute of Public Health. (2020).
Ntrogendioksid
. [Online]. Available: https://www.fhi.no/nettpub/luftkvalitet/temakapitler/nitrogendioksid2/?term=&h=1 -
Norwegian Institute of Public Health. (2022).
Luftforurensning i Norge
. [Online]. Available: https://www.fhi.no/nettpub/hin/miljo/luftforureining--i-noreg/?term=&h=1 -
Norwegian Institute of Public Health. (2023).
Nye luftkvalitetskriterier for svevestøv og nitrogendioksid
. [Online]. Available: https://www.fhi.no/meldinger/nye-luftkvalitetskriterier-for-svevestov-og-nitrogendioksid/ -
Norwegian Public Roads Administration. (2005).
Boligpriser og nærføringsulemper. Verdireduksjon på grunn av nærføringsulemper fra veg. UTB-rapport 2005/04
.Oslo
:Statens vegvesen
. -
NOU 2020:16.
Levekår i byer. Gode lokalsamfunn for alle
.Oslo
:the Norwegian Government
. [Online]. Available: https://www.regjeringen.no/contentassets/ccc978f8e2184980b4597ba59796e7e3/no/pdfs/nou202020200016000dddpdfs.pdf -
Næss, P.(2009). Residential Self-Selection and Appropriate Control Variables in Land Use: Travel Studies.
Transport Reviews
, 29 (3): 293–324. https://doi.org/10.1080/01441640802710812 -
Næss, Ø.,Piro, F. N.,Nafstad, P.,Smith, G. D.&Leyland, A. H.(2007). Air Pollution, Social Deprivation, and Mortality: A Multilevel Cohort Study.
Epidemiology
, 18 (6). https://doi.org/10.1097/ede.0b013e3181567d14 -
Olsson, D.,Johansson, C.&Forsberg, B.(2020). Associations between vehicle exhaust particles and ozone at home address and birth weight.
International journal of environmental research and public health
, 17 (11): 3836. https://doi.org/10.3390/ijerph17113836 -
Ouidir, M.,Lepeule, J.,Siroux, V.,Malherbe, L.,Meleux, F.,Rivière, E.,Launay, L.,Zaros, C.,Cheminat, M.&Charles, M.-A,, et al. (2017). Is atmospheric pollution exposure during pregnancy associated with individual and contextual characteristics? A nationwide study in France.
Journal of Epidemiology and Community Health
, 71 (10): 1026. https://doi.org/10.1136/jech-2016-208674 -
Planning and Building Act. (2008).
Lov om planlegging og byggesaksbehandling
.[Online]. Available: https://lovdata.no/dokument/NL/lov/2008-06-27-71 -
Pollution Control Act. (1981).
Lov om vern mot forurensninger og om avfall
. [Online]. Available: https://lovdata.no/dokument/NL/lov/1981-03-13-6 -
Public Health Act. (2011).
Lov om folkehelsearbeid
. [Online]. Available: https://lovdata.no/dokument/NL/lov/2011-06-24-29 -
Reisel, L.,Hermansen, A. S.&Kindt, M. T.(2019). Norway: Ethnic (In) equality in a social-democratic welfare state.
The Palgrave handbook of race and ethnic inequalities in education
: 843–884. https://doi.org/10.1007/978-3-319-94724-2_20 -
Rodopoulou, S.,Stafoggia, M.,Chen, J.,de Hoogh, K.,Bauwelinck, M.,Mehta, A. J.,Klompmaker, J. O.,Oftedal, B.,Vienneau, D.&Janssen, N. A. H., et al. (2022). Long-term exposure to fine particle elemental components and mortality in Europe: Results from six European administrative cohorts within the ELAPSE project.
Science of The Total Environment
, 809: 152205. https://doi.org/10.1016/j.scitotenv.2021.152205 -
Raaschou-Nielsen, O.,Andersen, Z. J.,Beelen, R.,Samoli, E.,Stafoggia, M.,Weinmayr, G.,Hoffmann, B.,Fischer, P.,Nieuwenhuijsen, M. J.&Brunekreef, B., et al. (2013). Air pollution and lung cancer incidence in 17 European cohorts: Prospective analyses from the European Study of Cohorts for Air Pollution Effects (ESCAPE).
The Lancet Oncology
, 14 (9): 813–822. https://doi.org/10.1016/s1470-2045(13)70279-1 -
Raaschou-Nielsen, O.,Thorsteinson, E.,Antonsen, S.,Holst, G. J.,Sigsgaard, T.,Geels, C.,Frohn, L. M.,Christensen, J. H.,Brandt, J.&Pedersen, C. B., et al. (2020). Long-term exposure to air pollution and mortality in the Danish population a nationwide study.
EClinicalMedicine
, 28. https://doi.org/10.1016/j.eclinm.2020.100605 -
Raaschou-Nielsen, O.,Taj, T.,Poulsen, A. H.,Hvidtfeldt, U. A.,Ketzel, M.,Christensen, J. H.,Brandt, J.,Frohn, L. M.,Geels, C.&Valencia, V. H., et al. (2022). Air pollution at the residence of Danish adults, by socio-demographic characteristics, morbidity, and address level characteristics.
Environmental Research
, 208: 112714. https://doi.org/10.1016/j.envres.2022.112714 -
Stafoggia, M.,Cesaroni, G.,Peters, A.,Andersen, Z. J.,Badaloni, C.,Beelen, R.,Caracciolo, B.,Cyrys, J.,Faire, U. d.,Hoogh, K. d., et al. (2014). Long-Term Exposure to Ambient Air Pollution and Incidence of Cerebrovascular Events: Results from 11 European Cohorts within the ESCAPE Project.
Environmental Health Perspectives
, 122 (9): 919–925. https://doi.org/10.1289/ehp.1307301 -
Stafoggia, M.,Oftedal, B.,Chen, J.,Rodopoulou, S.,Renzi, M.,Atkinson, R. W.,Bauwelinck, M.,Klompmaker, J. O.,Mehta, A.&Vienneau, D., et al. (2022). Long-term exposure to low ambient air pollution concentrations and mortality among 28 million people: results from seven large European cohorts within the ELAPSE project.
The Lancet Planetary Health
, 6 (1): e9–e18. https://doi.org/10.1016/s2542-5196(21)00277-1 -
Statistics Norway. (1999). Tettstedsavgrensing og arealdekke innen tettsteder.
Metoder og resultater. Rapport 1999/28
.Oslo
:Statistisk sentralbyrå
. -
Statistics Norway. (2020).
Hvor mye pendling er det mellom kommuner?
[Online]. Available: https://www.ssb.no/arbeid-og-lonn/artikler-og-publikasjoner/hvor-mye-pendling-er-det-mellom-kommuner -
Statistics Norway. (2023).
Prisindeks for brukte boliger. Tabell 06035: Selveierboliger etter region, statistikkvariabel, år og boligtype
. [Online]. Available: https://www.ssb.no/statbank/table/06035/tableViewLayout1/ -
Stroh, E.,Oudin, A.,Gustafsson, S.,Pilesjö, P.,Harrie, L.,Strömberg, U.&Jakobsson, K.(2005). Are associations between socio-economic characteristics and exposure to air pollution a question of study area size? An example from Scania, Sweden.
International Journal of Health Geographics
, 4. https://doi.org/10.1186/1476-072x-4-30 -
Temam, S.,Burte, E.,Adam, M.,Antó, J. M.,Basagaña, X.,Bousquet, J.,Carsin, A. E.,Galobardes, B.,Keidel, D.,Künzli, N., et al. (2017). Socioeconomic position and outdoor nitrogen dioxide (NO(2)) exposure in Western Europe: A multi-city analysis.
Environment International
, 101: 117–124. https://doi.org/10.1016/j.envint.2016.12.026 -
The Norwegian Mapping Authorities. (2023).
Kart over fylker og kommuner som endres 1. januar 2024
. [Online]. Available: https://www.kartverket.no/til-lands/kommunereform/endringskart-2024 -
Vardoulakis, S.,Kettle, R.,Cosford, P.,Lincoln, P.,Holgate, S.,Grigg, J.,Kelly, F.&Pencheon, D.(2018). Local action on outdoor air pollution to improve public health.
International Journal of Public Health
, 63 (5): 557–565. https://doi.org/10.1007/s00038-018-1104-8 -
von dem Knesebeck, O.,Verde, P. E.&Dragano, N.(2006). Education and health in 22 European countries.
Social Science & Medicine
, 63 (5): 1344–1351. https://doi.org/10.1016/j.socscimed.2006.03.043 -
WHO. (2021). WHO global air quality guidelines. [Online].
Geneva
:World Health Organization
. Available: https://www.who.int/publications/i/item/9789240034228