Development in Cadastral Surveying and Mapping in the Netherlands
About the Improved Cadastral Map of The Netherlands: Kadastrale Kaart Next
Ir. H.J., Geodetic expert
Department of Cadastral Surveying, Dutch Cadastre
Responsible for data quality and innovation
Publisert 27.08.2024, Kart og Plan 2024/2, Årgang 117, side 230-240
Kadaster provides legal certainty about every piece of land in the Netherlands. Cadastral parcels are recorded in land surveying fieldwork reports and processed in the nationwide cadastral map. The current map has a so-called graphic quality (standard deviation of boundaries are 20 cm for urban areas and 40 cm for rural areas); as a consequence, the current map is not suitable for determining the exact location of the parcel in the terrain. With increasing digitization, multiple sources of information (including the cadastral map) are becoming increasingly accessible to a wide range of users. This situation leads to incomprehension. That is the reason Kadaster has started a program to develop a map where the location of borders is so accurate that the map will be more in line with future developments. For this purpose, almost all (historical) field sketches are being processed. This challenge requires far-reaching automation. The research program has investigated whether it is possible to automatically extract the original measurements from the fieldwork reports and to combine this information and redetermine the location of the boundaries. With the help of artificial intelligence, it has been possible to build an accurate cadastral map of known geometrical quality. In addition to the technical challenge, investigations were also conducted into whether the more accurate map meets future needs. The arrival of the new map forsees a change in the way of communicating. The built-up reconstruction map will be introduced and presented as Kadastrale Kaart Next (KKN; in English, “Cadastral Map Next”), replacing the current cadastral map.
Keywords
- Cadastral surveying and mapping ,
- artificial intelligence ,
- geodetic calculation ,
- geometric quality of maps .
Introduction
This article explains the Dutch cadastral system with special focus on the cadastral map and the measurement of new established cadastral boundaries (part 1). The KKN program, aiming to improve the geometric quality of the cadastral map, is introduced and described; part 2 covers the technical aspects, and part 3 the societal ones.
1 Kadaster, History & Concepts
Kadaster’s History, Cadastral Map and Surveyor Field Reports
The Netherlands’ Cadastre, Land Registry and Mapping Agency (Kadaster for short) provides legal certainty about the ownership status of each piece of land in the Netherlands – the cadastral parcels. All the land parcels in the whole country had been created in the years prior to the beginnings of the Kadaster in 1832. The original field sketches, however, are in most cases not available anymore. The focus was on getting the cadastral map at scale and not on archiving the field sketches for boundary reconstruction purposes. The surveyors had to pay for their own paper, ink and measuring equipment, and often considered the sketches made in the field as their private property. Today most of the cadastral surveyors are Kadaster employees.
From that moment on new boundaries were measured accurately by surveyors when parcels needed to be altered (split or merged) and recorded in field sketches. These sketches form the basis of the boundaries in the cadastral map and are also used to reconstruct boundaries in the land upon request.
Unfortunately they did not store these documents in a central register until 1878, so valuable information about the exact location of the early boundaries has been lost, which makes the reconstruction of such boundaries difficult and not very accurate. Hence, since 1878, the fieldwork archive has been kept systematically and provided with a uniform layout.
The cadastral map provides a visualization of the (relative) location and shape of all cadastral parcels in the Netherlands. Such an image of 100% land coverage that is seamless throughout is very useful for a whole range of applications. However, the graphic quality of the boundaries in the cadastral map renders this map unsuitable for accurate measurements in the map. Initially the cadastral map was a collection of individual plans on paper. This means that mapping was done directly on paper and at scale (1:1000/1:2000), with consequences for accuracy.
The results of this process were fit for the purpose of the mapping, i.e. area calculation for land taxation. Only later was the cadastre also used to provide legal certainty.
Legal & Technical Foundation
Kadaster has a legally negative system which means on the one hand that the Kadaster cannot guarantee the quality of the stored and presented data, but on the other hand does everything to make the quality and reliability of the data as high as possible. Zevenbergen and Ploeger [4] provide more information about the legal aspects of cadastral systems, including the Dutch one. A central aspect of this system is the will of the landowners themselves. When a parcel is split into two or more new parcels, new borders have to be established. For each new border, the neighbours on both sides must agree on the definition of this new border. They do this by giving clear information to a Kadaster employee, who will measure everything necessary for later reconstruction and describe this accurately in field reports and the cadastral map. This new boundary is called the “cadastral boundary” and is the cadastral interpretation of the intention of the owners with this particular boundary. This intended boundary can be interpreted as a legal boundary at that particular moment; only a judge can come with reasons to change the location of a cadastral boundary when he or she thinks that the “real” (legal) boundary should be somewhere else at a later moment. When neighbours later come up with suggestions for new locations, this leads to the land being split into new parcels and new borders being defined instead of the borders being changed.
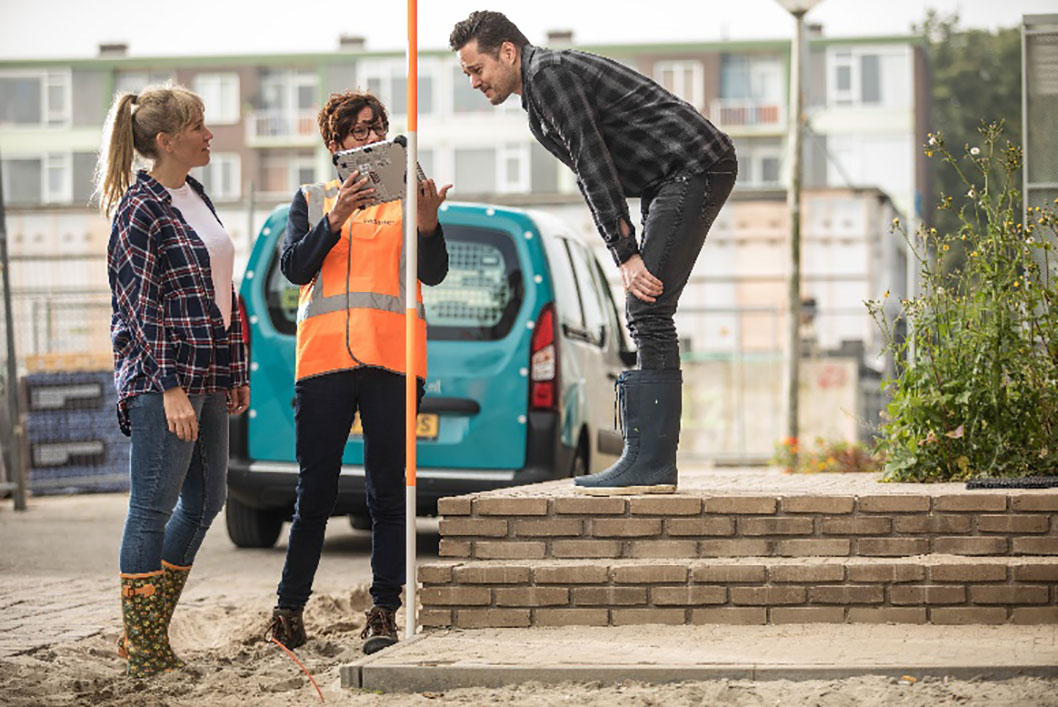
Figure 1.
Defining a Boundary with Neighbours.
The technical foundation of cadastral surveying and mapping in the Netherlands can be found in the so called “Handleiding voor de Technische Werkzaamheden van het Kadaster” (HTW; in English, “Manual for the Technical Activities of the Cadastre”). Four versions of this manual exist: 1902, 1938, 1956, and 1996. The content is both scientific and practical, and is a reliable framework for developing work processes and quality control. The mathematical geodesy methods for adjustment and testing, as developed by the Delft University of Technology and referred to as the “Delft school of Mathematical Geodesy”, is the basic concept.
Field Sketches and Cadastral Map
As mentioned, the field sketches have been archived since 1878. Today all field sketches are scanned nationwide and accessible to Cadaster staff (for the public, only upon request and the paying of a fee). An important function of the field sketches is their use in the reconstruction of cadastral boundaries in case of disputes between neighbours about the location of their common parcel boundary. An example of a field sketch is provided in Figure 1. In most cases the sketch was originally made by hand. The sketch has no strict scale, as the scale is variable and is related to the information density required and observed in the field. Cadastral observations can be based on measurements with tapes, total stations, GNSS, etc. Observations describe the relation between the boundary and its environment, for example corners of buildings. Via the consequent use of GNSS in almost all the projects for the last 20 years, the connection to the national coordinate system (Rijksdriehoeksmeting or RD) can be made. The measurements and observations in the field sketch are documented digitally and made digitally accessible.
The field sketch includes the name of the cadastral municipality, the cadastral section letter and the cadastral parcel IDs of the parcels involved in the subdivision. The date of the survey is included and references to earlier field sketches related to boundaries of the parcel(s) involved, and observations as foot point of a survey line, distances, ‘perpendicular’, ‘parallel’, ‘extensions’, ‘straight line’, etc. The field sketch visualizes which points or lines establish the boundary.
Boundary reconstructions by cadastral surveyors based on field sketches with original observations regarding the disputed boundary, are mostly accepted by both owners, but in case of continued disagreement between the owners they can go to the court for a final decision. The layout of the field sketch has changed over time – and looks much more formal today than the example from 1957 shown in Figure 2.
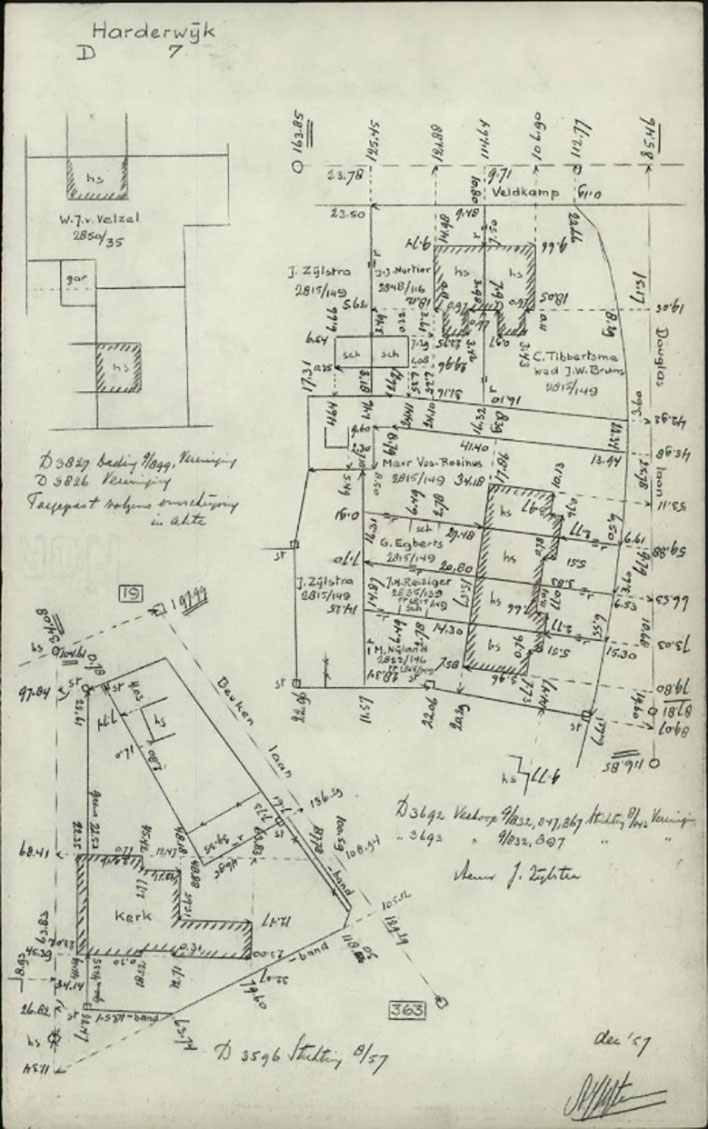
Figure 2.
Example of a Field Sketch from 1957.
The cadastral map was fully digitized by 1994, and the usability of the map was substantially improved after harmonisation with the large-scale topographic map and the connection of all the individual map sheets in a period of ten years after that moment.
Nevertheless, the graphical quality of the represented boundaries in the cadastral map makes this map unsuitable for accurate measurements in the map. The standard deviation of boundary points in the map is 20 cm for urban areas and 40 cm for rural areas. This is why the documented observations from the field sketches, and not the map as such, are used for boundary reconstructions. However, the cadastral map is accessible as a seamless nationwide map and comprises the graphical representation of about 8 million cadastral parcels and parcel identifiers, together with main buildings and addresses for orientation. An excerpt of the cadastral map of the Netherlands is shown in Figure 3.
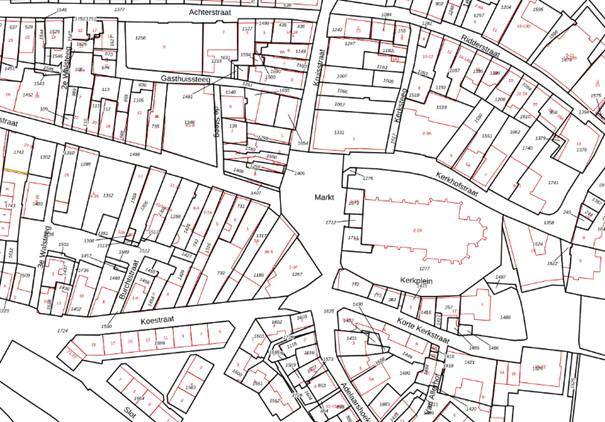
Figure 3.
Excerpt Netherlands Cadastral Map.
2 Kadastrale Kaart Next (KKN)
When using the cadastral maps, the public expects the possibilities of the map to be much higher than what can be guaranteed from the data quality. The correlation of boundaries when overlaying it with information from other sources (such as topographical maps) is less clear or accurate and therefore a potential source of misunderstanding. Misunderstandings are also created through the increasingly better connection of digital maps and the ability to easily combine them and to zoom in. In the current information-driven society, this situation leads more frequently to bottlenecks and sometimes to misunderstandings.
The fact that the cadastral map was made available as open data years ago, and can be viewed and combined by a broad user base, contributes to this. The user lacks the insights into the meaning and history of the current cadastral map. The map is essentially meant to be an index (with parcels of land as entry points) to the land registry, for which the current graphic quality is sufficient. However, users currently do not realize this (any longer) and expect greater accuracy and applicability of the information displayed. In addition to misunderstandings about the exact location of boundaries, the inaccuracy of the surface area of parcels in the cadastral map is an increasingly greater problem due to the difference with the officially shown surface area of the parcel in the registry.
To live up to its responsibility, Kadaster strives to improve the aforementioned situation and dreams of an ideal: a map where the location of boundaries is so accurate that a much broader scope of application is created and the map performs better in the digital society. In other words, a situation where the combination of data sources and, for example, the relationship with 3D objects and digitization strengthens this and produces no (more) bottlenecks. The value of the information would thereby greatly increase.
Initial explorations in 2015 indicated that in order to be able to make this dream come true, all of the (historical) fieldwork reports have to be used and processed. This would be a huge challenge that demanded time and implied costs for a significant level of automation, as a complete manual construction of the map would not be not cost effective. The alternative of remeasuring all of the boundaries would be even more expensive, as well as legally and technically undesirable, and therefore not an option.
A research programme was launched within Kadaster in 2017 (see also [1]) in collaboration with certain companies specialized in artificial intelligence in order to determine the manner in which the information from the historical fieldworks could be processed in an automated way to establish the “Reconstruction Map”. This is the working title for the more accurate cadastral map with known geometrical quality and higher accuracy. Examinations have been performed as to whether it is possible to automatically extract the original measurements from the fieldwork reports with innovative (data) technology such as machine learning and to combine and validate this information into an accurate map. The research results were promising, and in 2023 the production of the map began.
Production of the Reconstruction Map
In order to create a reconstruction map, all of the measurement data from the fieldwork reports need to be extracted, measurement data from different fieldwork reports have to be linked to each other, and the entire network has to be calculated. Then, the current boundaries will have to be identified from the lines, which include the historical boundaries and buildings as well. For this purpose, the current cadastral map serves as a reference. In Figure 4 these steps are explained in more detail. The big challenge is investigating whether significant automation of the necessary manual processes is possible when reading scanned analogue fieldwork reports and calculating the data from the fieldwork reports in relation to each other. For these calculations, software that allows for a complete automatic quality check and description will be used.
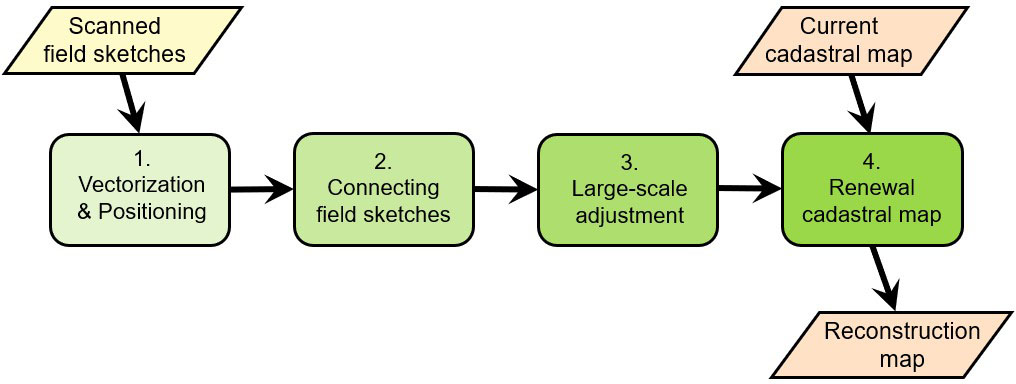
Figure 4.
Overview of the Four-Step Approach to Renewal of the Cadastral Map.
The first two steps of the process are described in more detail in Franken et al. [3]. There, the tooling developed for the digitization of the field sketches and the interactive environment for validation and coupling is discussed. In all four steps, quality assurance is applied and integrated in the tooling. The approach adopted is the Delft school of Mathematical Geodesy and is described in more detail in van den Heuvel et al. [2]. The renewal process comprises the following four steps:
- 1.
Vectorization and positioning. Digital scans of the field sketches are vectorized, resulting in digitised survey measurements. The vectorization is largely automated via the application of machine learning techniques. However, due to variation in content and quality, a manual correction step is needed, for which interactive tooling has been developed. For this purpose, various elements, such as line elements and text elements, must be recognized, the lines must be cut to intersections, the text elements read, and then the interrelationship between the elements derived.
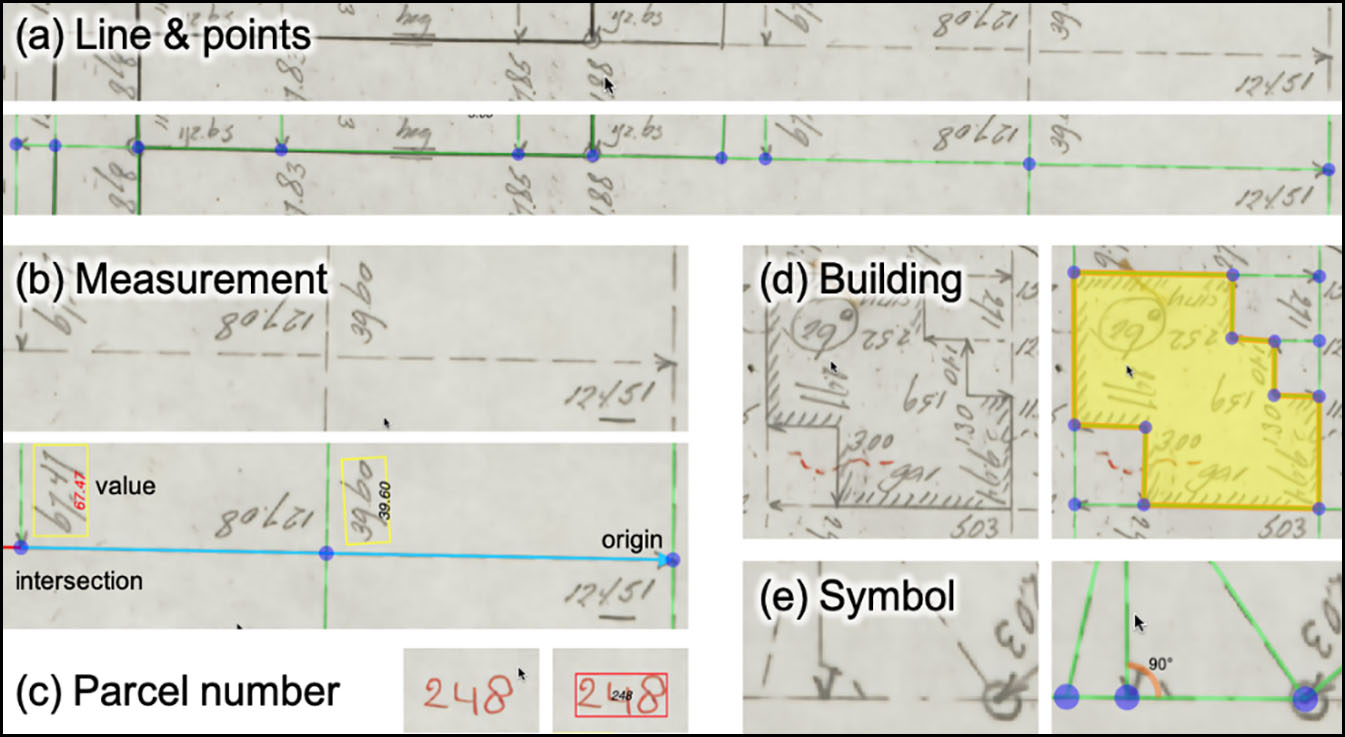
Figure 5.
Information Units Extracted During Vectorization Using the AI-Based Solution.
- 2.
Connecting field sketches. In this step, all information is gathered for a geodetic network adjustment over an area with multiple field sketches. Here, homologous points between the field sketches are identified. Besides the connection between field sketches, the connection to the reference point field representing the national coordinate system (Rijksdriehoekstelsel) and the current cadastral map is established. This reference point field consists of several million points usually measured with GNSS. This step is finalized with several network adjustment that aims at validating the measurements.
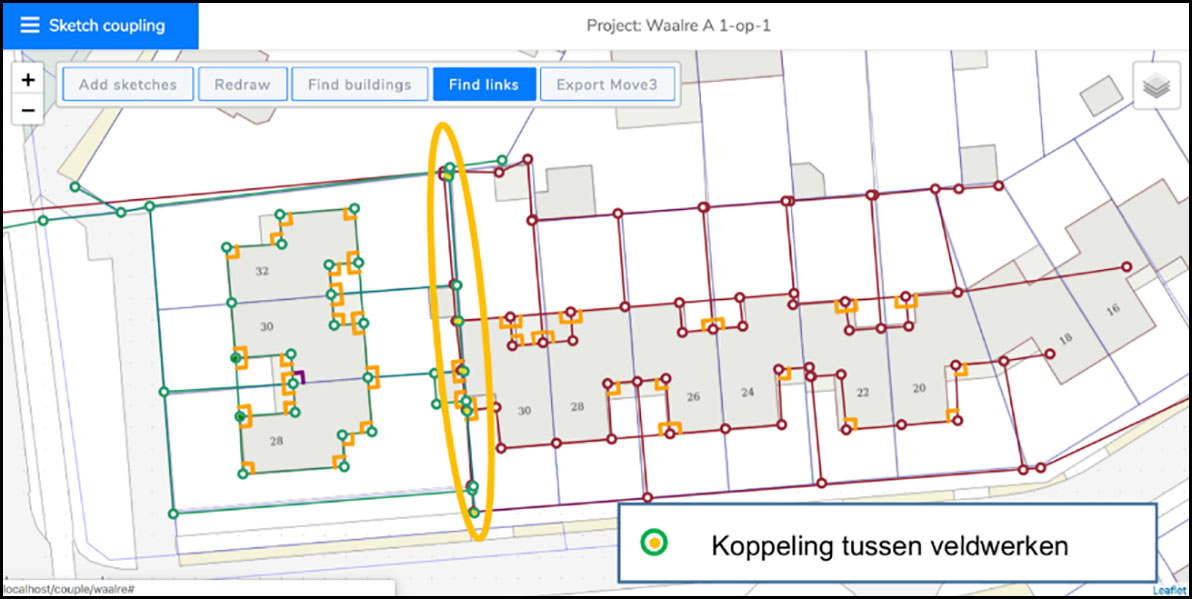
Figure 6.
User Interface VeCToR; Links between Two Field Sketches.
- 3.
Large-scale adjustment. With this step we aim at integrated adjustment of the measurements of hundreds of field sketches. However, it is not feasible to adjust all observations in one step, as we anticipate something in the order of a billion observations for the whole country. Therefore an approach for dealing with discrepancies between results of neighbouring large-scale adjustments has been developed. This phase results in detailed coordinates (in the national system) for all involved points, including a description of geometric quality by very tall covariance matrices.
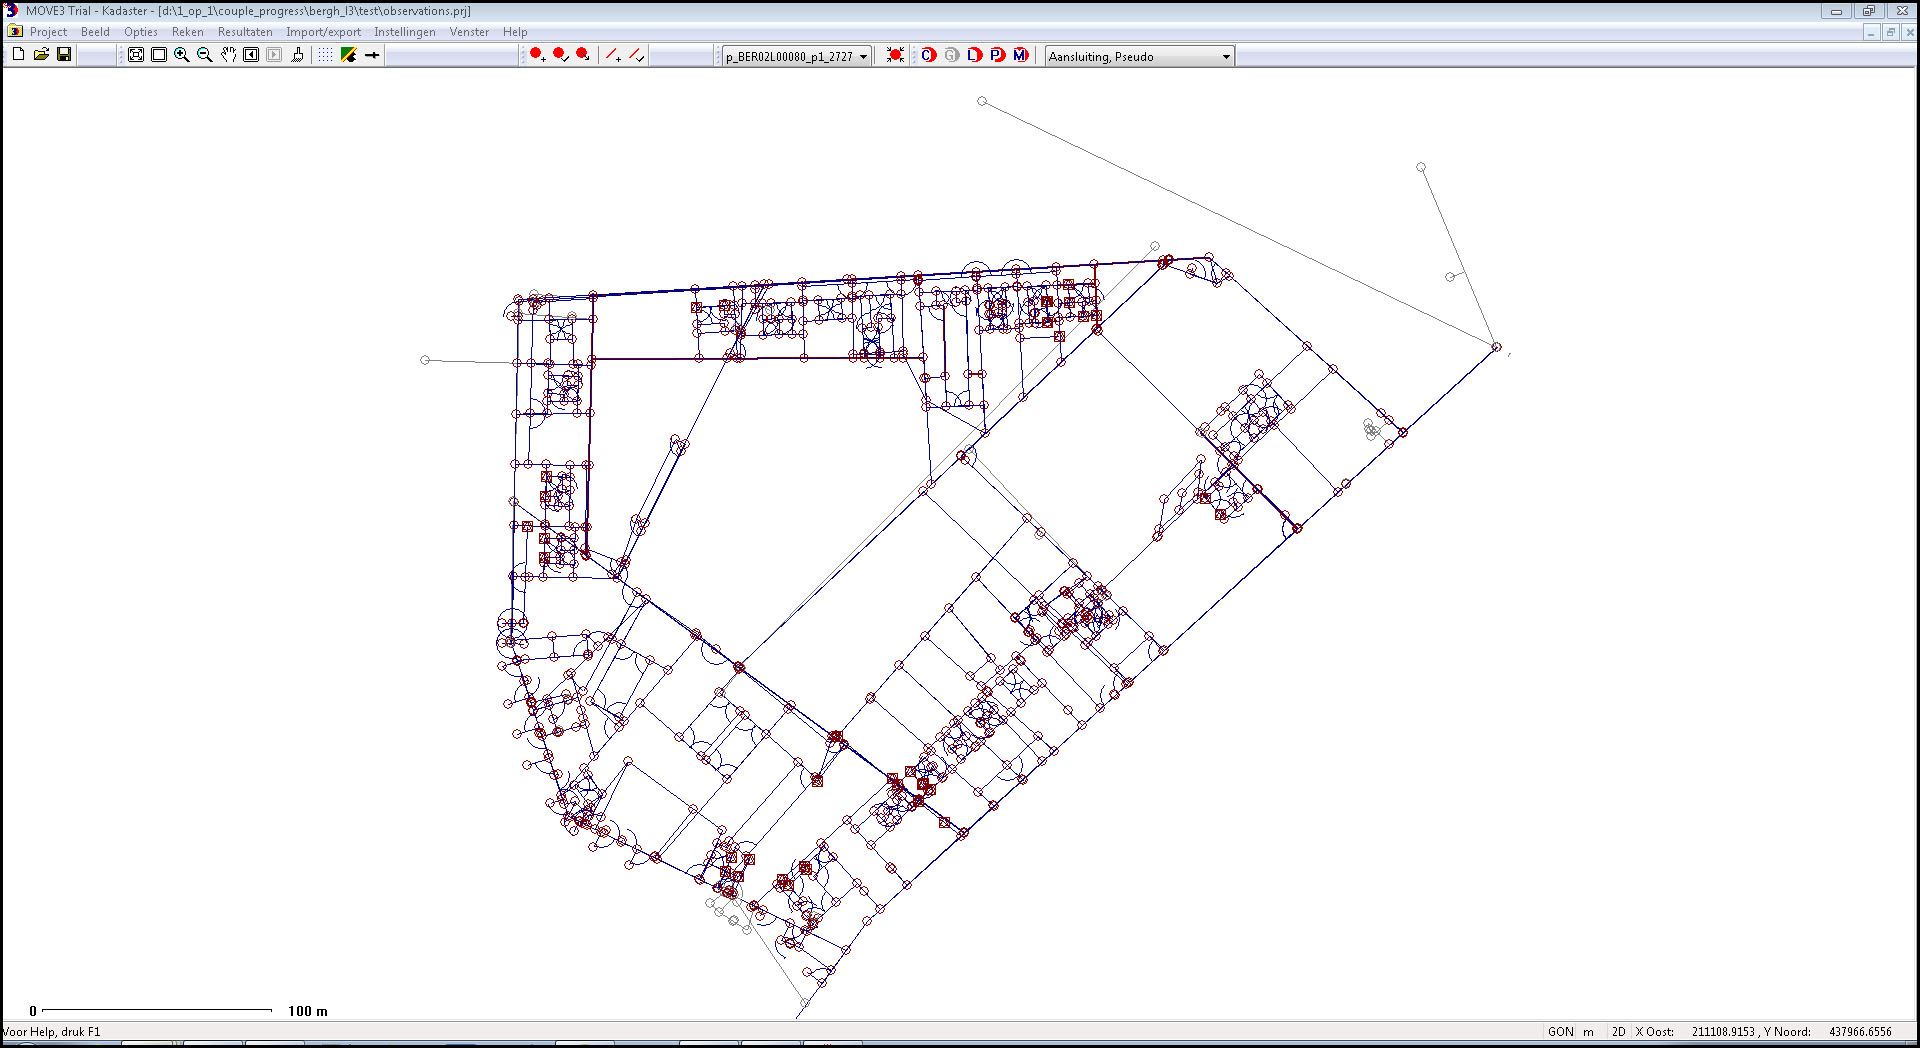
Figure 7.
Eleven Connected Field Sketches Forming a Geodetic Network.
- 4.
Renewal of the cadastral map. Finally, the relation between the cadastral map and the predescribed point field is established. Key to this process are the relations between the two point sets. These relations have been established in the linking phase. An adjustment is set up in which all points of the cadastral map are updated, accounting for the quality of both sets, resulting in the reconstruction map. To be able to store this new map and also the relation to the old map a update for the datamodel and database is needed (see also [5]).
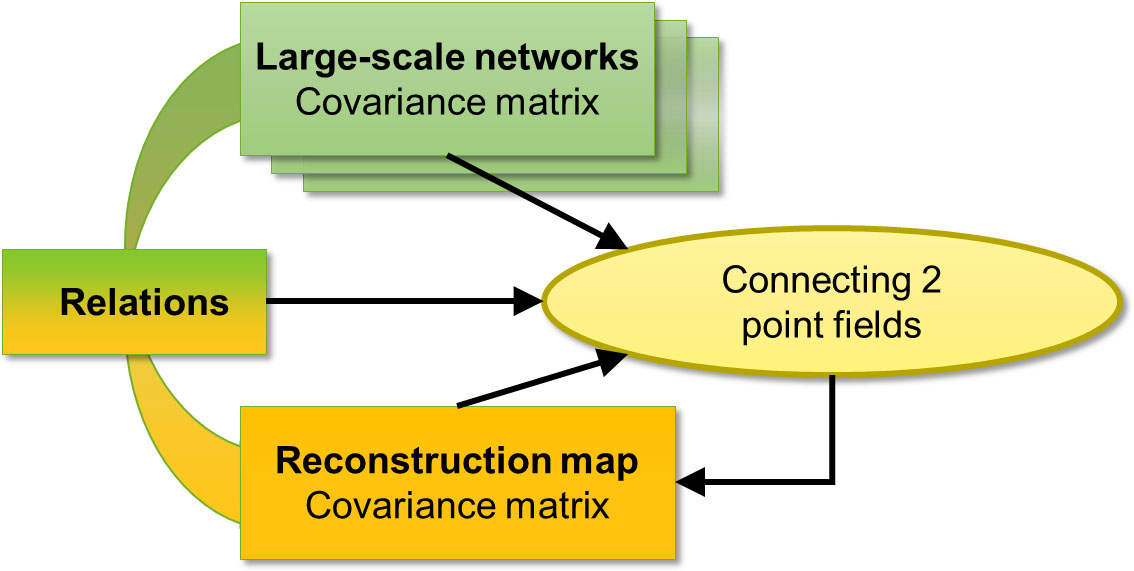
Figure 8.
Scheme of the Connecting Adjustment that Results in the Reconstruction Map.
3 Transition Process
The decision to replace the current cadastral map with the more accurate line image of the reconstruction map (the transition to Kadastrale Kaart Next) must be accompanied by the following measures:
-
Informing and cooperating with local governments so that they can act as a communication partner towards the public. Alignment with the other map products, especially the agencies responsible for topographical mapping.
-
The general public must be aware of the actual (current) quality and the improved quality. Transparency about quality must be closely associated with increasing visibility for users, so that it becomes more comprehensible and more reliable. This requires an awareness campaign that must be established nationwide.
-
Individual users will have to be guided in the event of questions or complaints. This can become a significant task due to the large scale of the change.
Communication and provision of information are increasingly important in contemporary society. The right communication at the right time is also vital for Kadaster, which has a societal function. Communication is important in order to maintain confidence in the system’s legal certainty as well as to maintain the cadastral organization and inform users of the significance and added value of the advocated changes, also compared to the existing situation.
On first sight the legal impact of the changes is limited: the cadastral map is only a graphical representation and we have the right to change the boundary representation in the map within the reliability limits. However, the new cadastral map can give better estimations for the calculated parcel areas. This can lead, when differences exceed a certain level, to changes in the officially registered parcel sizes. If that is the case, we have the obligation to officially inform the owners – a potentially difficult situation when parcel sizes decrease. This means that a careful approach is required when steering the changes.
There are three phases to be distinguished over time: current, development of reconstruction map, and transition. The interconnection of these components is shown in Figure 9. Note that there is only one valid cadastral map at a time.
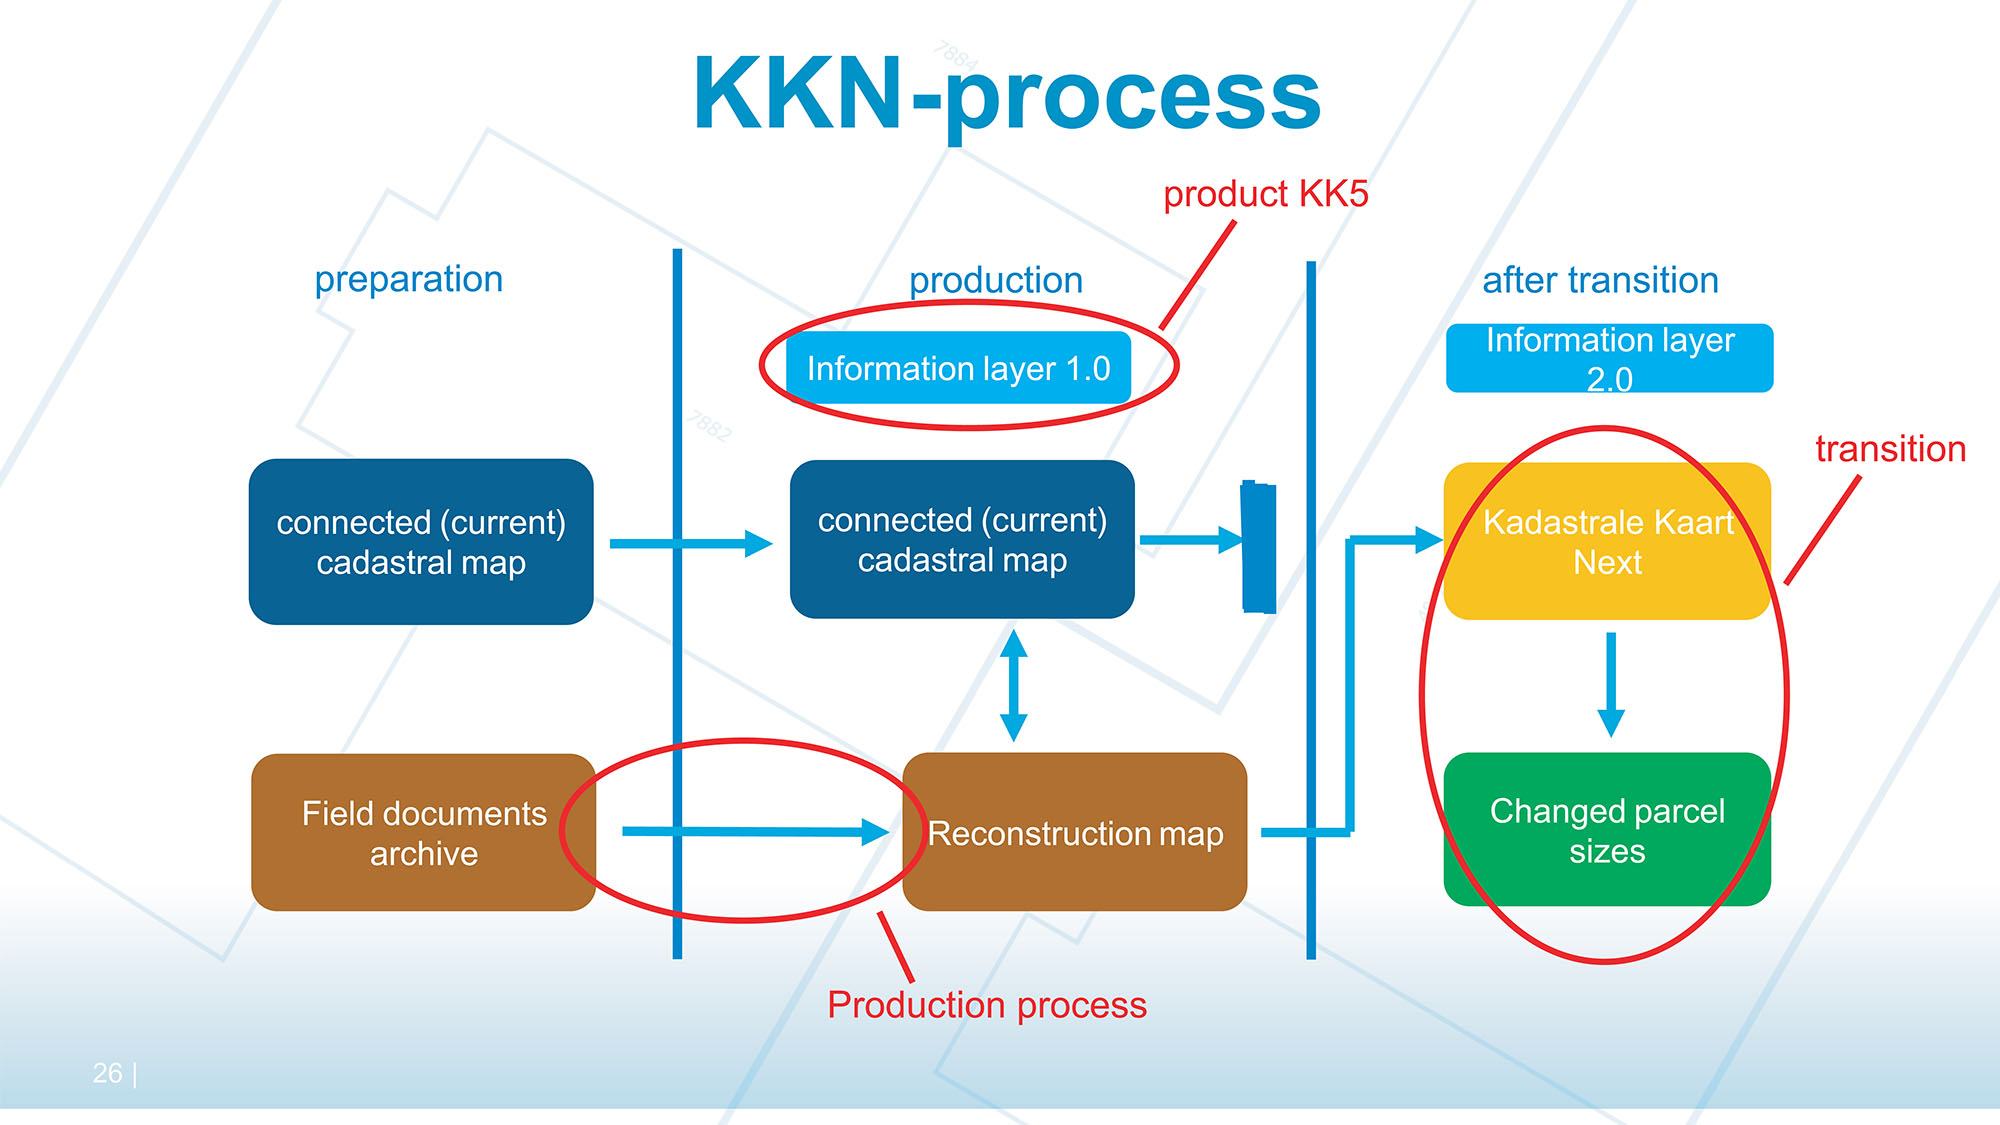
Figure 9.
The Transition Process.
The information layer (metadata) is meant to indicate the quality of the cadastral map using existing data sources. For this purpose, the relevant data from several data sources are linked to the data from the cadastral map, providing a semantic enrichment of the cadastral data with metrics. This produces a more complete and clearer picture of the cadastral boundaries and parcels. This information layer is an important resource in the indication of quality and in the communication with the public about map quality. A new product (kadastrale kaart version 5, KK5) that shows the individual quality has recently been launched: green means good precision, yellow means graphical quality.
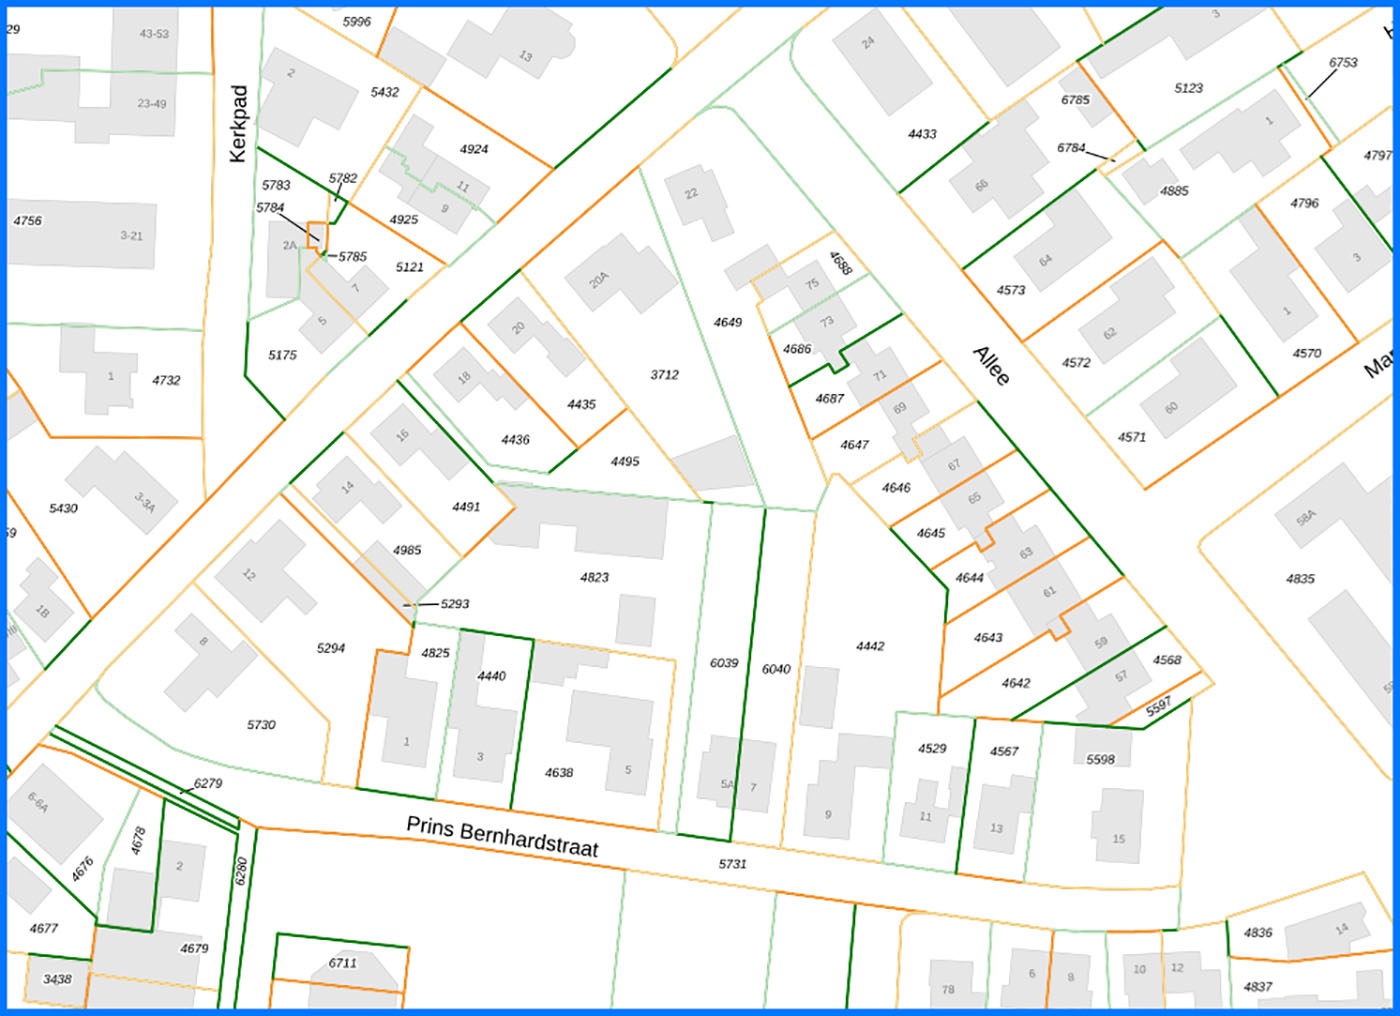
Figure 10.
Example of Boundary Quality Labeling.
Graphical quality means point quality of 20 cm (standard deviation) for urban and 40 cm for rural areas. Terrestric quality (green) has a standard deviation of 5 or 10 cm. In the current situation about 10% will have this highest quality; for the new KKN we expect that about 80% will have the desired presion. By presenting this, users can rely on greater quality.
Aspects such as legal certainty and trust play a large role in the approach. It is critical that confidence in the authority is maintained and will be guaranteed when changes in the data are introduced. Transparency about quality must be closely associated with increasing visibility for users so that it becomes more comprehensible and more reliable. The old one was good enough for a long time, but now it is no longer. Cooperation with local governments will have to be configured due to alignment with other map products and communication with individuals.
Finally
In 2023, after a long tender procedure, we started production together with two Indian companies; the forecast is a production period of five years. It will take some years before the first improved cadastral maps, together with the benefits, will be available to society.
References
-
[1]Eric Hagemans,Ruben Busink,Jeroen GriftandFrank Schouten
– Rebuilding the Cadastral Map of The Netherlands, the Overall Concept
. FIG working week, 2020, 2021,The Netherlands (online)
. -
[2]Frank vanvdenvHeuvel,Gerbrand Vestjens,Gerard verkuijlandmark van den Broek
– Rebuilding the Cadastral Map of The Netherlands, the Geodetic Concept
. FIG working week, 2020, 2021,The Netherlands
(online). -
[3]Jeroen Franken,Wim Florijn,Maarten Hoekstraet al.
– Rebuilding the Cadastral Map of The Netherlands, the Artificial Intelligence Solution
. FIG working week, 2020, 2021,The Netherlands
(online). -
[4]Jaap ZevenbergenandHendrik Ploeger
– What Would Title Registration Bring to a Deeds System with High Quality Land Information?
(9972). FIG Working Week 2019 Hanoi,Vietnam
-
[5]Eric Hagemans,Chrit Lemmen,Eva Maria Ungeret al. – The new, LADM inspired, data model of the Dutch Cadastral Map.
Elsevier Land Use Policy
, 2022.